

Ice sheets and glaciation
Here we build on our introductory knowledge on ice sheets from earlier by exploring how they work and how glacial processes shape the continent, and the rest of the world.
Warm up
Glacier ice
Worldwide, glaciers cover about 10% of the Earth’s land area, and Antarctica accounts for about 85% of this total cover. By volume, Antarctica contains 90% of the world’s glacier ice – enough ice to raise world sea level by almost 60 metres if it were all to melt.
While the glacier ice of Antarctica, which covers over 99% of the continent, is often referred to as the Antarctic Ice Sheet, as pointed out in the Introduction to Antarctica’s Ice Sheets section, Antarctica is made up from different ice sheets. Here we will be focussing on the two bigger ice sheets, the East and the West Antarctic Ice Sheets.
The main differences between these two are:
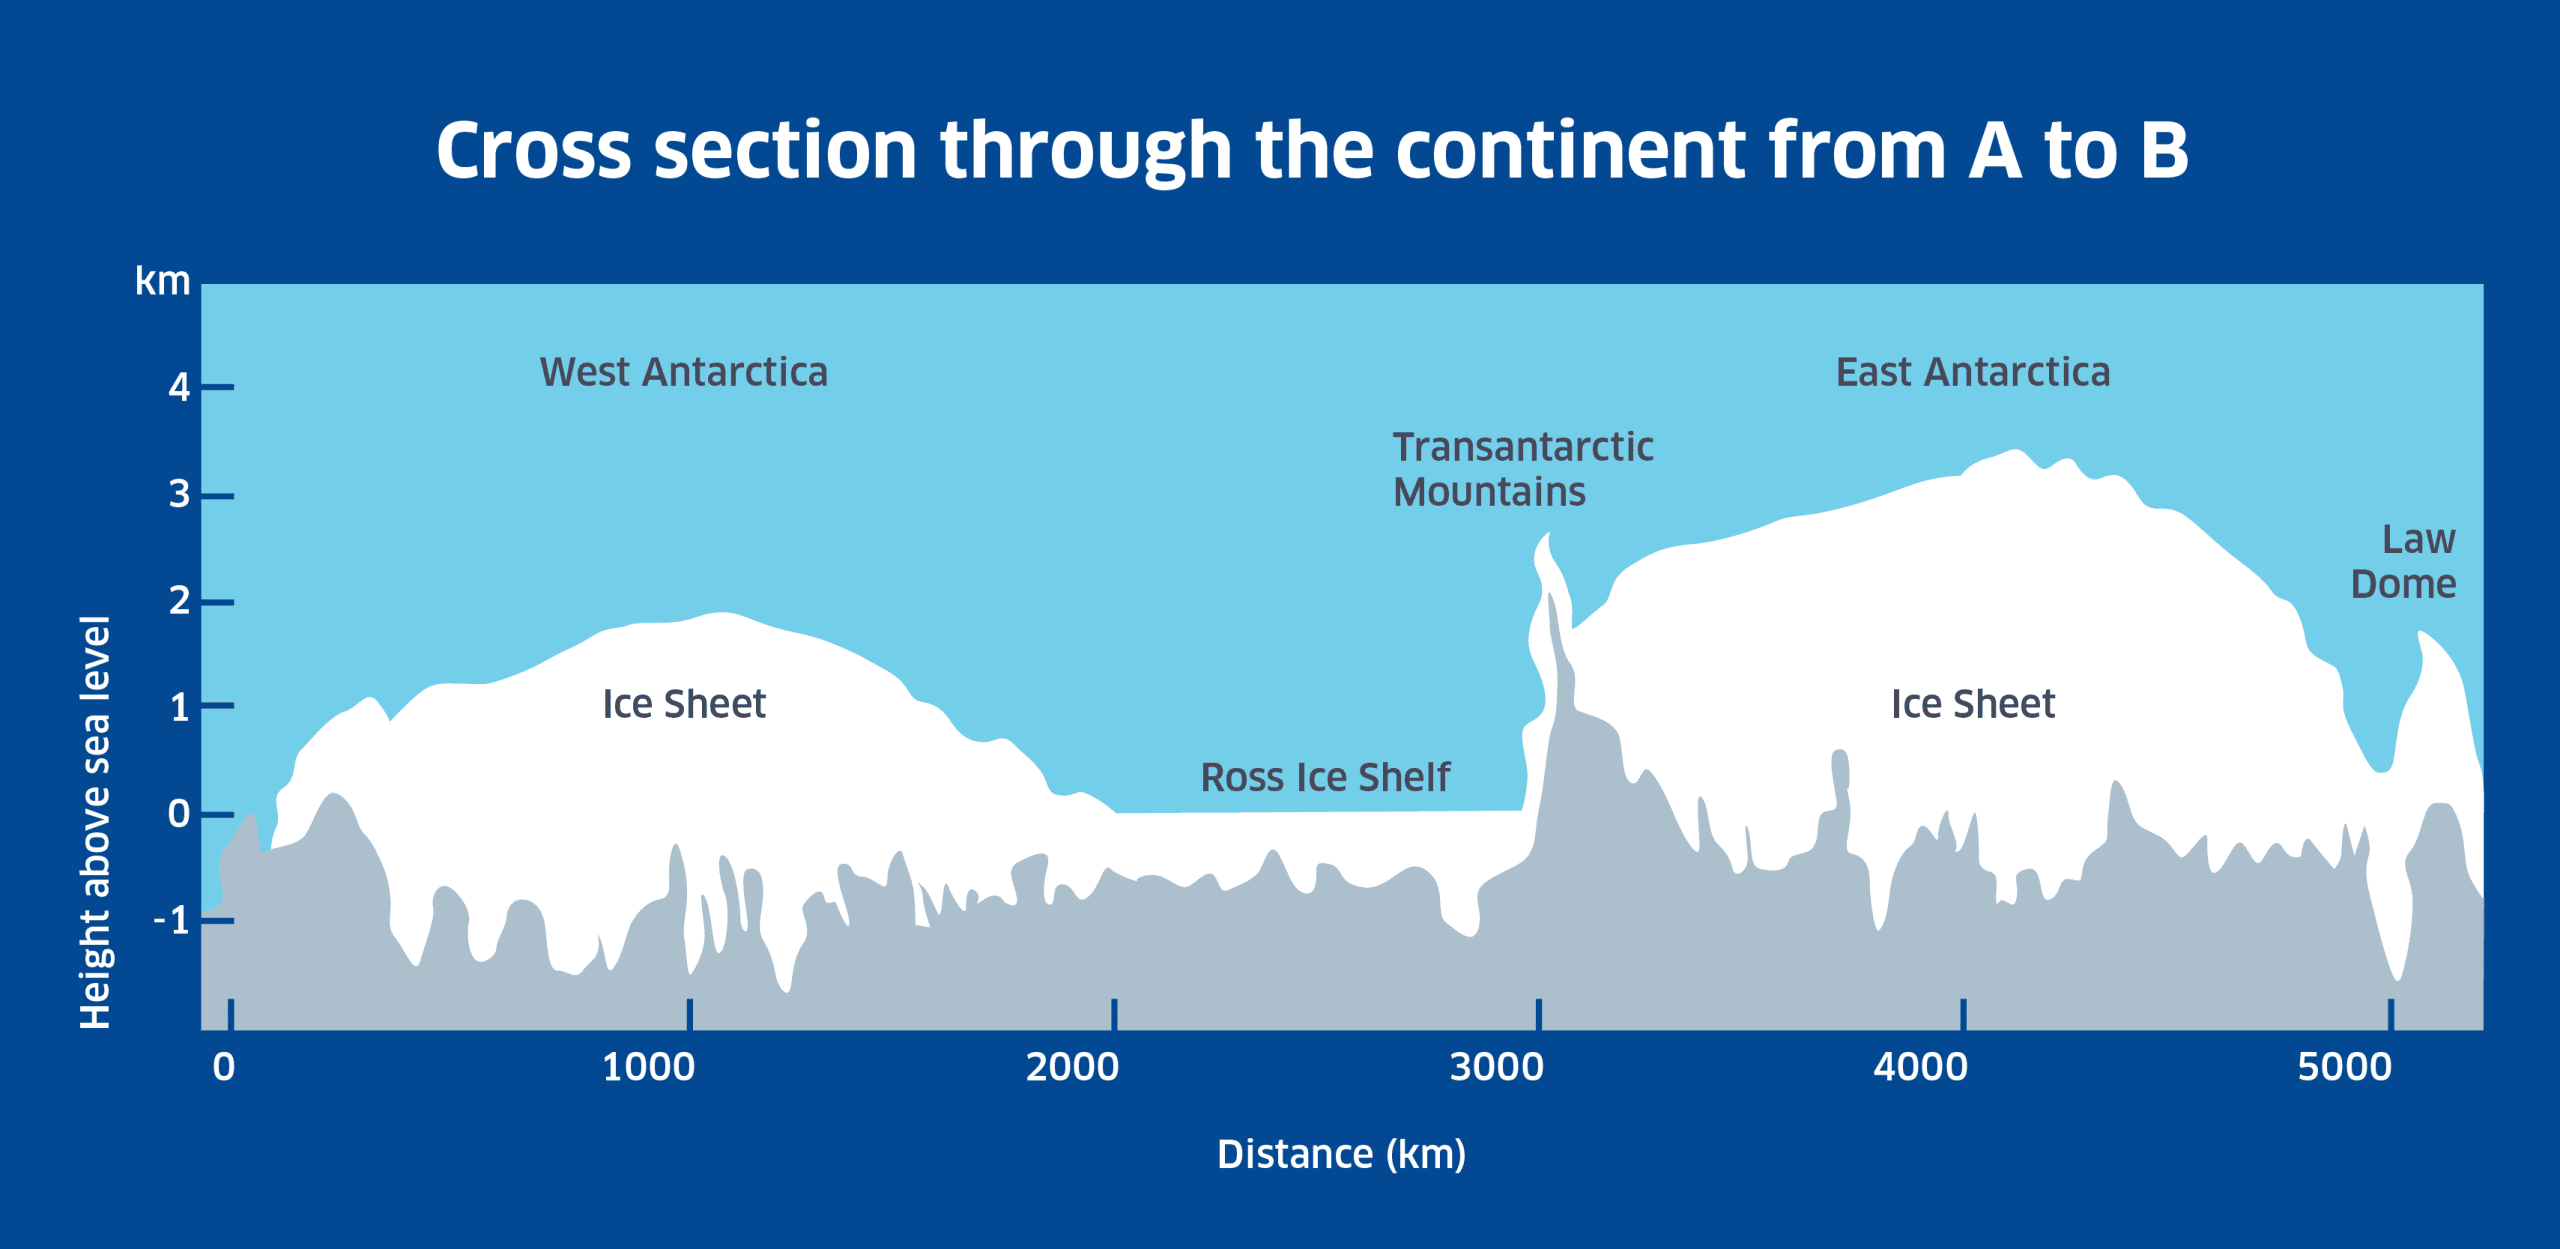
- The East Antarctic Ice Sheet (EAIS) has about 9 times the volume of the West Antarctic Ice Sheet (WAIS).
- The EAIS has an average thickness of 2226m compared with the WAIS maximum of 1306m.
- The EAIS reaches a higher elevation (over 4000m at Dome Argus) than the WAIS.
- In contrast with the EAIS, the WAIS sits on bedrock that is mostly below sea level (lowest bed elevation of 2496m below sea level).
Click here to explore the Antarctic Jigsaw to see if you can piece Antarctica back together again
These major differences are summarised in these plan view and cross-section diagrams of Antarctica:

Cold facts
Glaciers as systems
Ice sheets are constantly on the move: the processes which govern the behaviour of ice sheets are fundamentally the same, if on a much larger scale, as those governing other glaciers. Ice sheets come into existence as many smaller glaciers gradually enlarge and coalesce; and for this to happen, there needs to be a prolonged period over which accumulation (by snowfall) exceeds ablation (which can occur either by melting or by calving of icebergs into the sea). (The timing and reasons for ice sheet build up in Antarctica are discussed in Tectonic History: Into The Deep Freeze).
What’s happening to the land beneath Glaciers?
Glaciers in all of their different forms have profound effects on the landscape through processes of erosion and deposition as discussed further below. Ice sheets have the additional effect of depressing the elevation of the bedrock on which they sit due to their great weight. This is explained through the concept of isostasy: where the ice is thickest, Antarctic crust has been depressed by as much as 500 metres because it is so heavy.
Signs of Glacier Movement
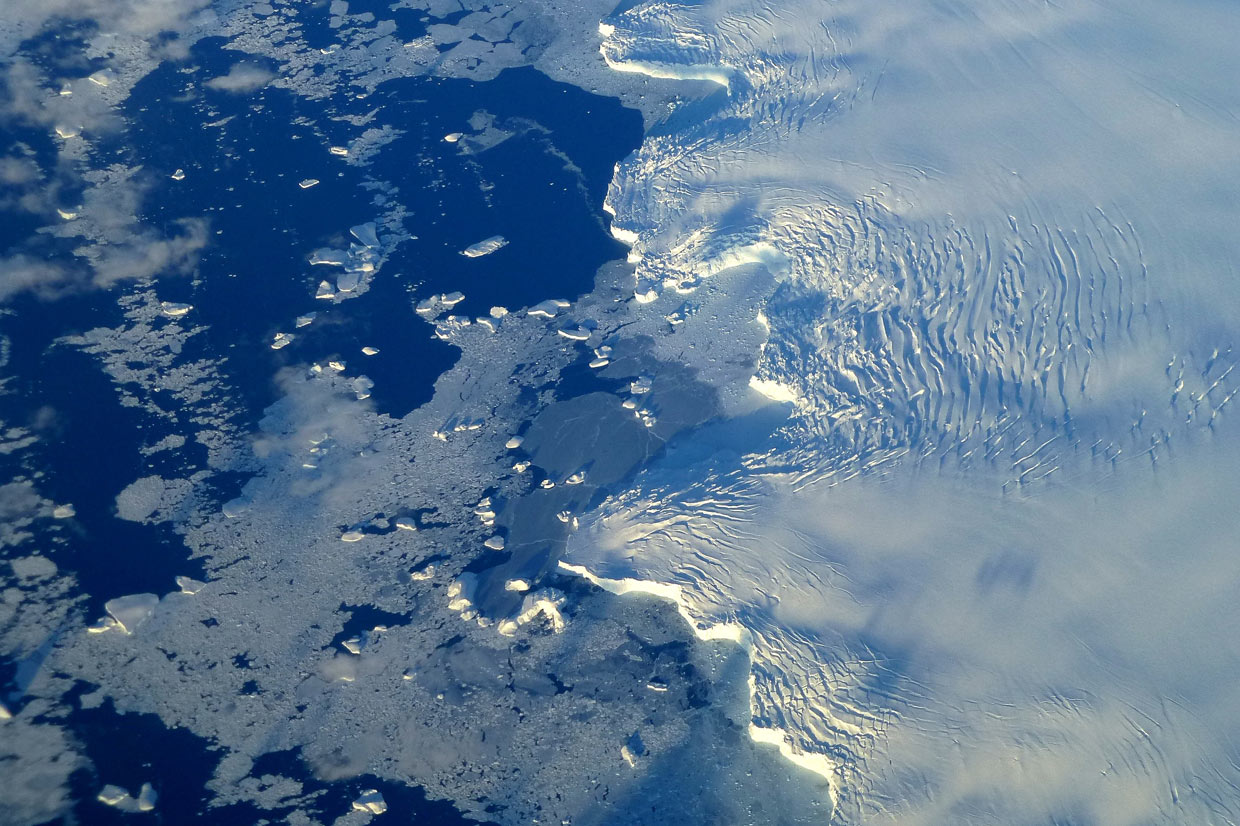
Accumulation occurs as snowfall and frost formation which adds mass to the surface of the ice. Over time, the snow crystals are buried under more recent precipitation, eventually reaching a depth where they are compacted into glacier ice. Under pressure, the glacier ice deforms and is then able to flow. Because glaciers flow very slowly, it is hard to imagine them moving. However, we can see see from certain formations in the ice, such as crevasses and flowstripes shown on aerial photographs that they are moving. You can see some crevasses in the photo below, can you spot them? (Hint: they look like ripples of lines in the ice). More information about crevasses can be found in the download sheet here.
Glacier Mass Balance
As with other natural systems, the balance of inputs (accumulation) and outputs (ablation through melting, calving etc), and the rates of ice flow in the glacier system vary over time due to both external and internal factors. External factors include changes in snowfall and air temperature: if, for example, there is a decline in snowfall and/or increase of temperature, then there will be a period of time when melting (or sublimation) exceeds the input of new ice and the glacier will lose mass until it reaches a new equilibrium between accumulation and ablation. (It is important to remember that even when a glacier is shrinking, ice still moves forward from accumulation zone to ablation zone.) An increase in snowfall relative to rates of melting has the opposite effect causing the glacier to gain mass. The relationship between a glacier’s total accumulation and ablation at any one time is known as its mass balance. Averaged over a year, this gives the glacier’s net balance which can be positive or negative, indicating whether it has increased or decreased in size.
Response of Antarctic glaciers to climate change
Many researchers are now focussing on estimating the future mass balance for the East Antarctic, and West Antarctic Ice Sheets, especially with future expected warming.
Given the huge proportion of the world’s glacier ice contained in Antarctica, any future changes in mass balance will have very significant effects on the rest of the world. If a warming world causes a period of negative mass balance (more ablation than accumulation) averaged across Antarctica, then the net transfer of H2O from ice on land to meltwater entering the oceans will contribute to eustatic sea level rise.
How can change be measured?
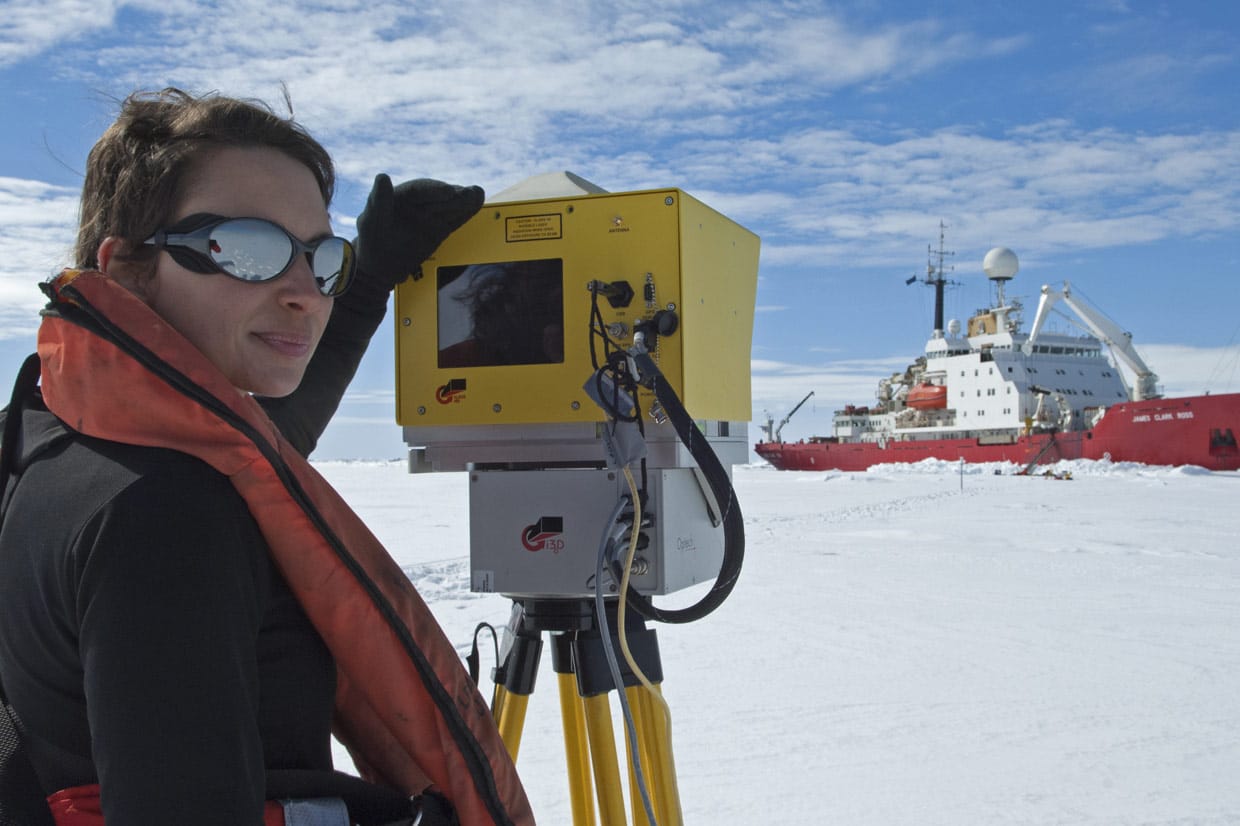
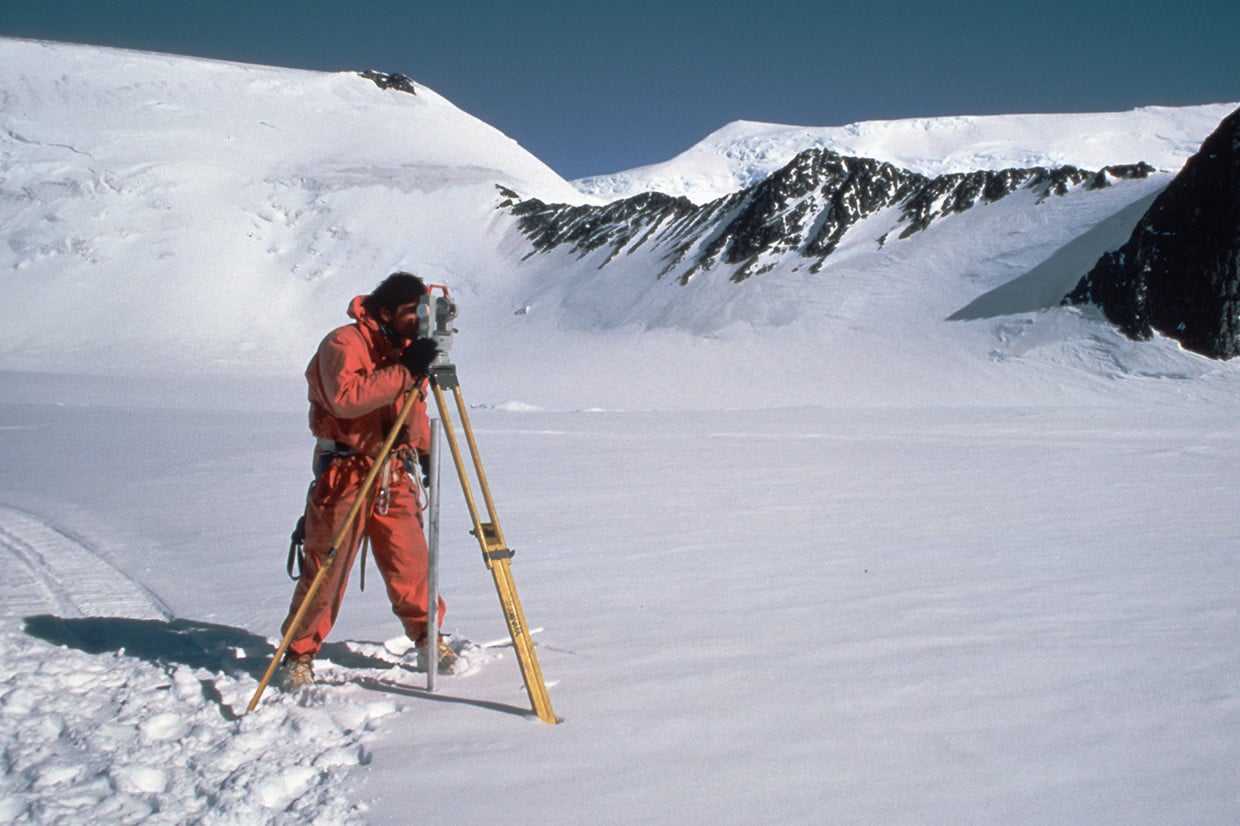
Estimating changes in the mass balance of Antarctic ice is very difficult and requires a combination of field surveys and remote sensing techniques are applied across a huge area over long periods of time. Changes in ice elevation and thickness can be monitored either remotely using satellite data with ice-penetrating radar, or in-field LiDAR, as shown in the photo below.
Remote satellite observations are ideal when large areas of ice need to be monitored, and when parts of the ice is unaccessible, like much of Antarctica for most of the year. However, these methods work the best when they are complimented by in-field measurements and observations as sometimes the satellite data may miss some important features.
What about the Future?
At present, the jury remains out on how the EAIS will respond to global warming this century; but there is good evidence that many glaciers in the Antarctic Peninsula have already shifted to a negative mass balance and are in retreat. This is the situation for almost all other glaciers outside of Antarctica.
The WAIS is also losing mass in some areas and is considered more vulnerable than the EAIS. This is because its average elevation is lower, much of it is grounded below sea level, and in places it is buttressed by ice shelves that themselves could be vulnerable to warming. If there were a major collapse of the WAIS (an unlikely but not impossible scenario over the next couple hundred years or so) this could contribute up to 6 metres of sea level rise. The link below shows land areas that would be flooded under this scenario:
A full understanding of the dynamics of Antarctic ice sheets and how they will respond to climate change requires awareness of the variation that exists within the ice sheets themselves. In the cold, interior regions of Antarctica ice flow is very slow, on the order of tens of metres per year, and the ice is predominantly cold-based. However, around the margins of the ice sheets there are areas where the glacier ice becomes warm-based and the discharge is much faster, sometimes exceeding 1000m per year. These ice streams only account for about 10% of Antarctica’s area but they are the major conduits for the transfer of ice from the accumulation zones to the ablation zones. Therefore long-term studies of the volume and flow rates of ice moving through ice streams are essential for estimating changes in the ablation rate for the ice sheets as a whole.
Ice shelves
We have touched upon ice shelves briefly in earlier topics, however here we will be exploring them in a touch more detail as they are important for the transfer of ice through the ice sheet system.
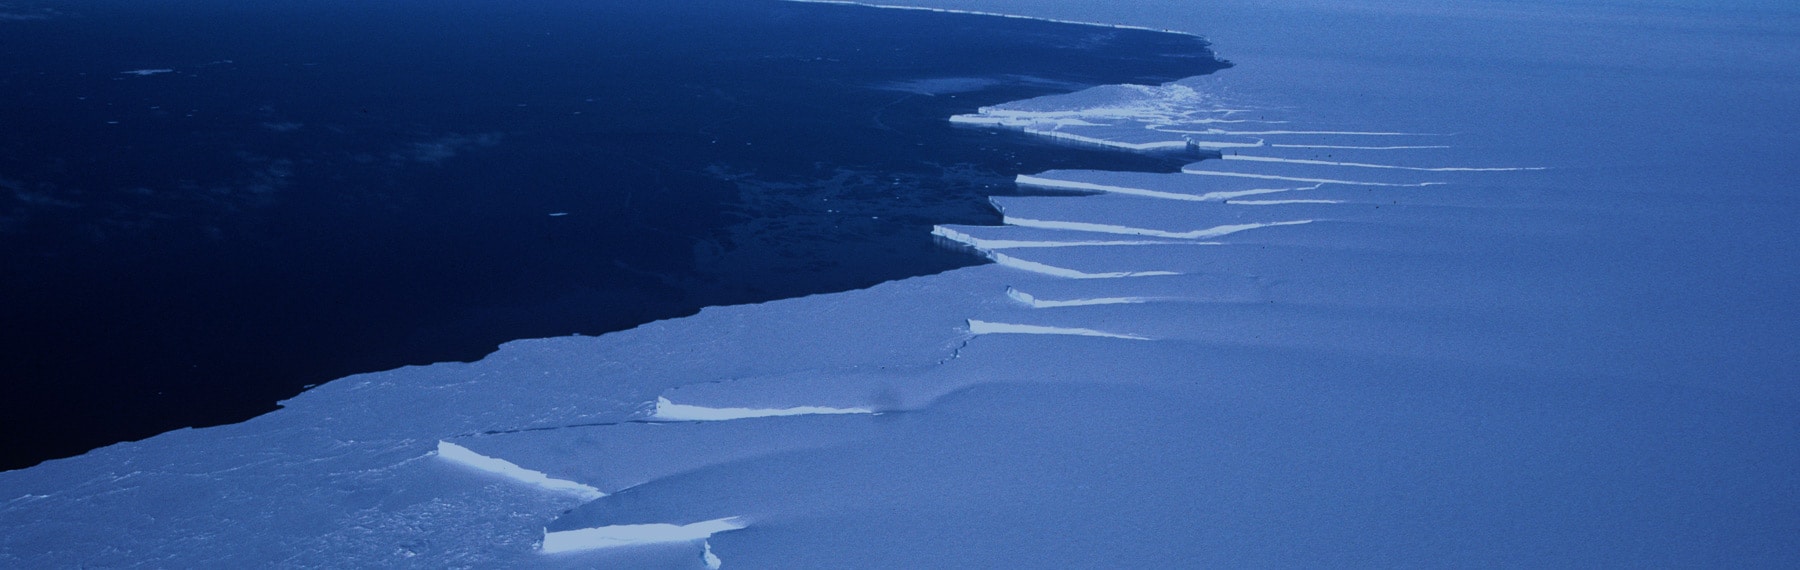
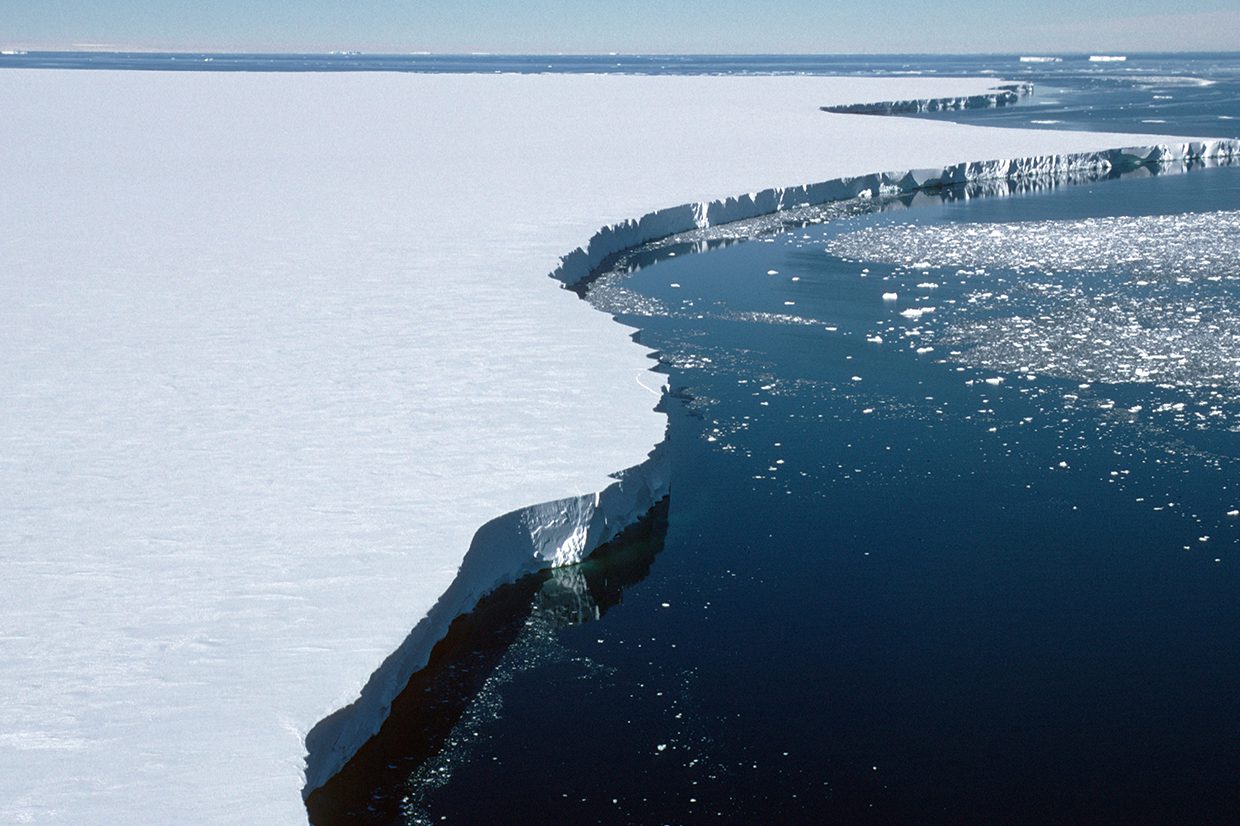
As a reminder, ice shelves are areas where part of an ice sheet extends into the sea and floats because ice is less dense than water. The lack of frictional resistance with bedrock causes the ice in ice shelves to move at a high velocity, up to 3km per year, and glacier ice is discharged to the sea as the edges of the ice shelf break off and float away as icebergs (a process termed ‘calving’). Ablation of the Antarctic Ice Sheet occurs primarily through this process rather than by melting of the ice surface. There is, however, melting along the base of floating ice shelves because of the warmer ocean water. The Ross Ice Shelf and the Ronne-Filchner Ice Shelf each cover an area larger than the British Isles. Smaller ice shelves along the Antarctic Peninsula are losing mass as a result of climate change as described further in The Coast And Adjacent Ocean.
Effects of glaciation on land and offshore
Glaciers are huge masses of solid ice, so their movement can cause significant changes to land around them, and the surrounding offshore region. This is because they are great at both eroding, and transporting rocks and other sediment. There are many factors that control the rates of both erosion and depositional processes; but in general, areas of faster moving, warm-based ice shape the land more rapidly than areas of slow, cold-based ice.
Here we will be learning about just a few common examples of erosional and depositional landforms resulting from glacial activity
Erosional Landforms
Both glacial plucking and glacial abrasion whilst the glacier is moving through a valley can deepen and widen the valley sides to create the classic parabolic shape associated with present and former glaciated valleys. These are called U-Shaped Valleys.
As a major valley is widened, the spurs of tributary valleys become worn back to form truncated spurs. Glacial erosion that is concentrated on two or more sides of an area of high relief leads to the formation of arêtes and pyramidal peaks. These large-scale features of glacial erosion can be seen in Antarctica where rock protrudes above the surface of the ice sheet.
Depositional Landforms
Since much of Antarctica’s glacier ice reaches the coastline and beyond, much of the material carried in Antarctic ice is taken to the sea and deposited as ice rafted debris; and, given the limited area of land that is ice free, there are not many places where depositional landforms caused by glaciation are easily viewed. However, moraines, which are deposits of rock and sediment, can be seen around the margins of glaciers that terminate inland, such as glaciers that terminate in the Dry Valleys.
Student activity 1
On the base map of Antarctica locate and label the following places and areas of ice:
-
WAIS
-
EAIS
-
Dome Argus
-
Dome Circe
-
Dome Fuji
-
Vostok
-
Ross Ice Shelf
-
Ronne-Ice Shelf
-
Filchner Ice Shelf
-
Larsen Ice Shelf
-
Brunt Ice Shelf
-
Amery Ice Shelf
-
Shackleton Ice Shelf
-
Byrd Glacier
-
Pine Island Glacier
-
Beardmore Glacier
You can use atlases and/or any of the links shown below:
Links for maps of Antarctica
-
NASA LIMA
(on this site select ‘Find an Antarctic Feature’ to obtain a satellite image) -
NASA LIMA: Overview map (pdf)
(this map shows contour lines)
Other links
At this site (a GIS programme) you can search by key words or place names by clicking in the ‘Query’ box on the binoculars icon. A drop down box will appear showing any locations that include the search term that are within the map data base. Click on the desired location and it will appear on the map. You might have to use the magnifying glass icons to zoom in to see the selected location.
Label
Label the map
Student activity 2
Download the image below of the Bernese Alps in Switzerland and add the following labels.
-
Pyramidal peak
-
Corrie glacier
-
Arête
-
U-shaped valley
-
Hanging valley
-
Truncated spurs
-
Valley glacier
![]()
You will find the complete image in the answer sheet.
Analyse
Student activity 3
An important way of measuring the surface velocity of Antarctic ice is the method of ‘crevasse tracking’. Crevasses are easy to identify on the ice surface, and they last long enough to be carried along with the ice flow. By identifying individual crevasses, and measuring how far they have moved during the time between two satellite pictures it is possible to work out the ice velocity.
3a Why is it important to track crevasses on a glacier? What can they tell us?
3b What advantages does crevasse tracking using satellite imagery have over ground-based field surveys for estimating ice velocities across Antarctica?
3c The attached Excel spreadsheet contains surface ice velocity data calculated for many points along the Byrd Glacier which cuts through the Transantarctic Mountains and feeds into the Ross Ice Shelf.
Download the spreadsheet: Ice surface velocity data from the Byrd Glacier (excel)
Using the functions in Excel conduct the following descriptive statistical analyses on the data from the spreadsheet:
-
What is the arithmetic mean (average) ice velocity (metres/year) at the surface of this glacier? What is the mean bearing for direction of surface ice flow?
-
What are the minimum and maximum measurements of surface ice velocity for this glacier? Also calculate the range and the standard deviation.
The second tab has the answers for the description statistics. Be sure to attempt on your own first!
Write
Student activity 4
One way of assessing the impact of climate change on Antarctic ice is to see whether or not ice flow is speeding up in the ice streams that feed ice from the interior towards the coast. In places where ice shelves are breaking up, there is concern that the grounded ice flow will speed up causing a net loss of glacier mass (negative mass balance) and a contribution to sea level rise.
-
Considering the type of data that you worked with for question 3, write a couple of paragraphs to describe the data you would need to test the idea described above. What descriptive statistics would you need and what type of ‘inferential’ statistical test would help you to decide whether the collapse of ice shelves has a statistically significant effect on the velocity of the ice streams that feed them?
