

The coast and adjacent ocean
What is the coastline of Antarctica like, and what physical processes occur along the coast and in the Southern Ocean?
Warm up
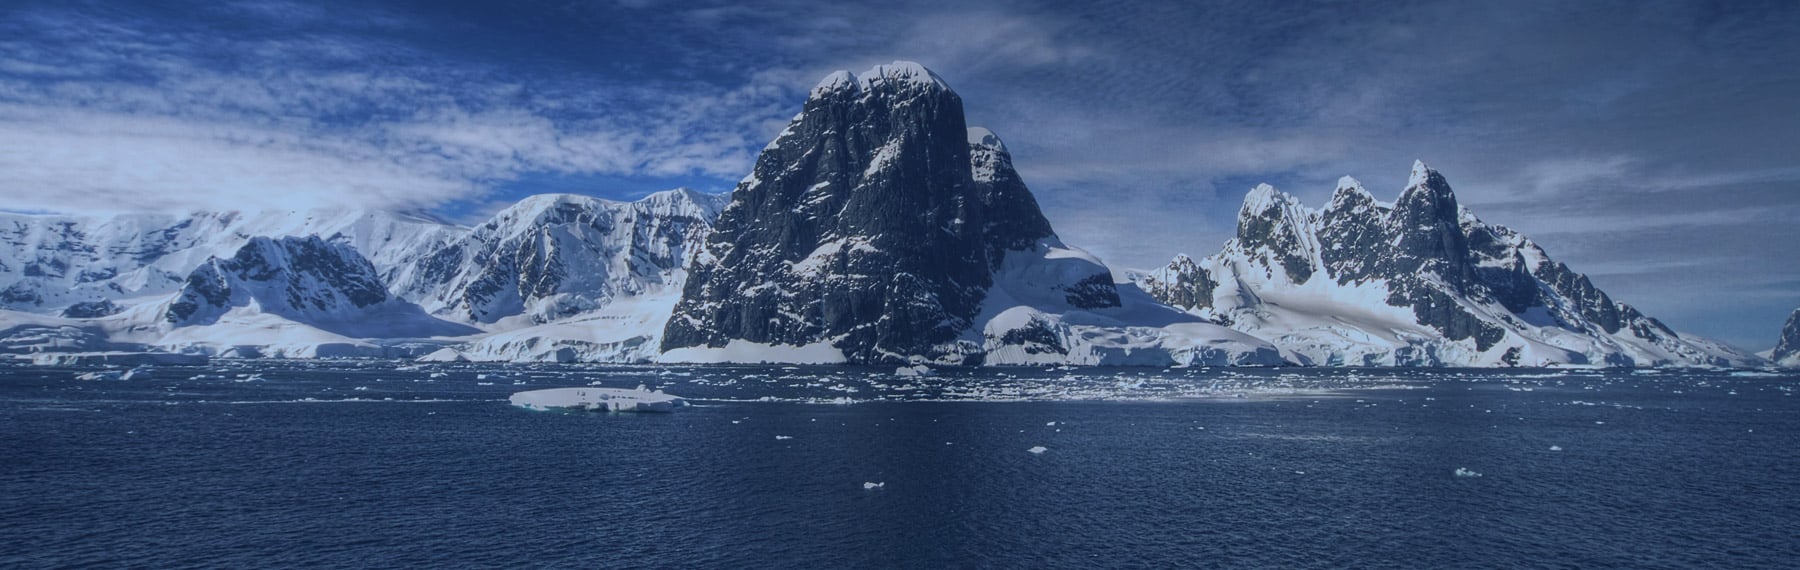
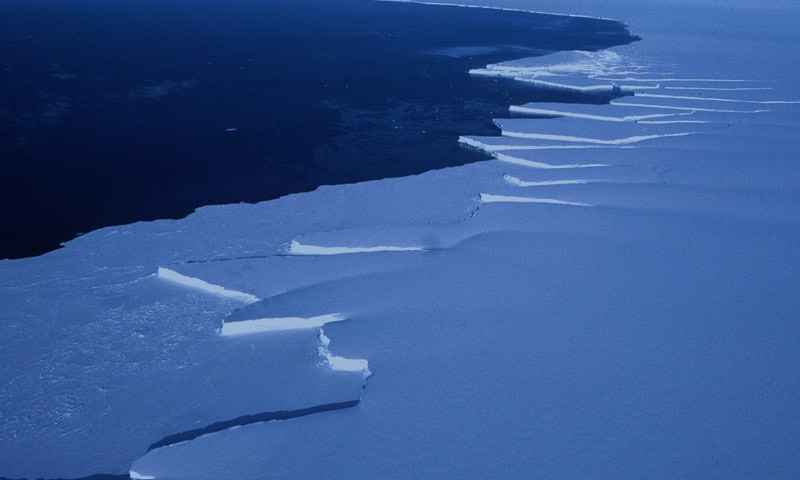
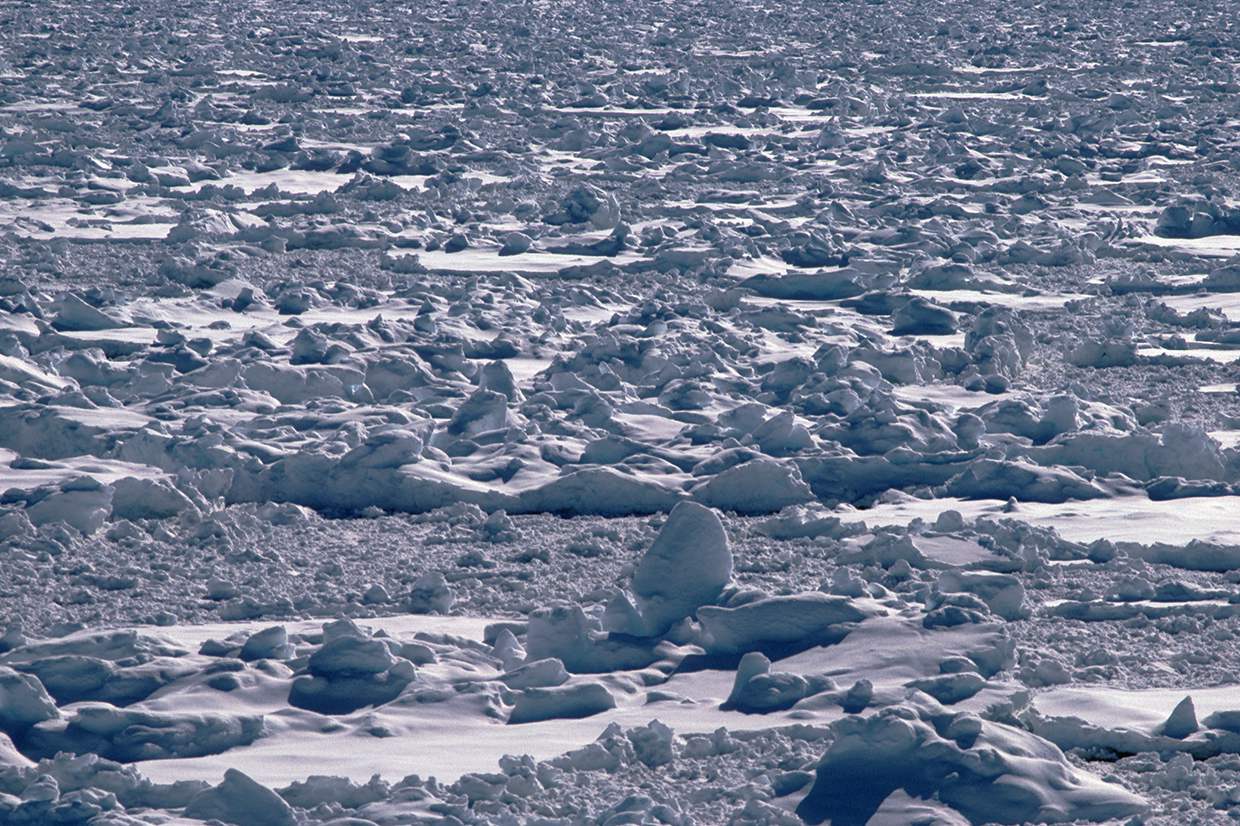
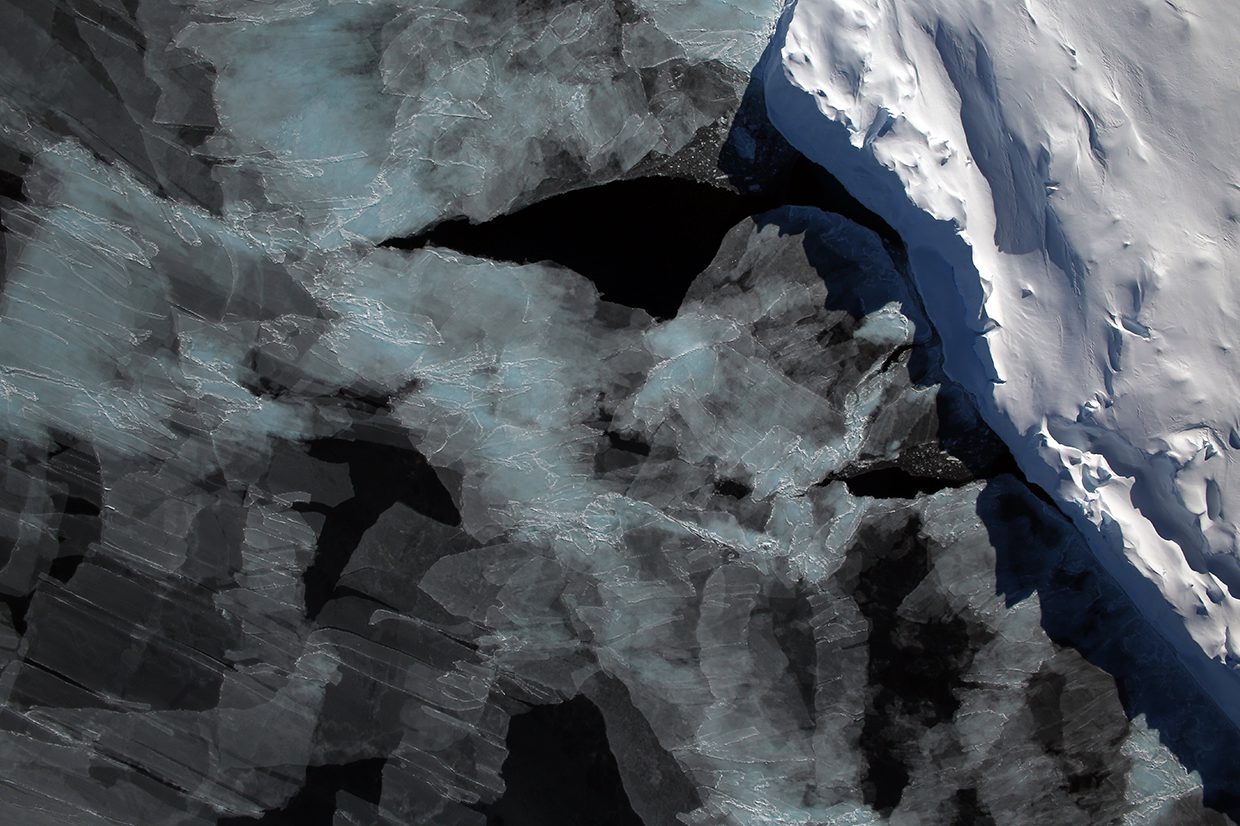
Study the following images taken along Antarctica’s coast. Attempt to identify the features shown in the images and describe the physical processes that are occurring.
Antarctica’s Coastline
Only about 5% of Antarctica’s coastline is what we would think of as typical for a coast – where either land (or rock) meets the sea. Instead, much of Antarctica’s coastline consists to the edges of ice shelves, or some places where the grounded ice directly meets the sea. The key difference between these two, is that the grounded ice is on land and resting on beck rock, and the ice shelves are extensions of ice on land which are floating on the sea.
What’s the difference between sea ice and ice shelves?
Sea ice is another icy feature which is present round Antarctica’s coastline. Sea ice and ice shelves are often confused, however there are some distinct differences between the two.
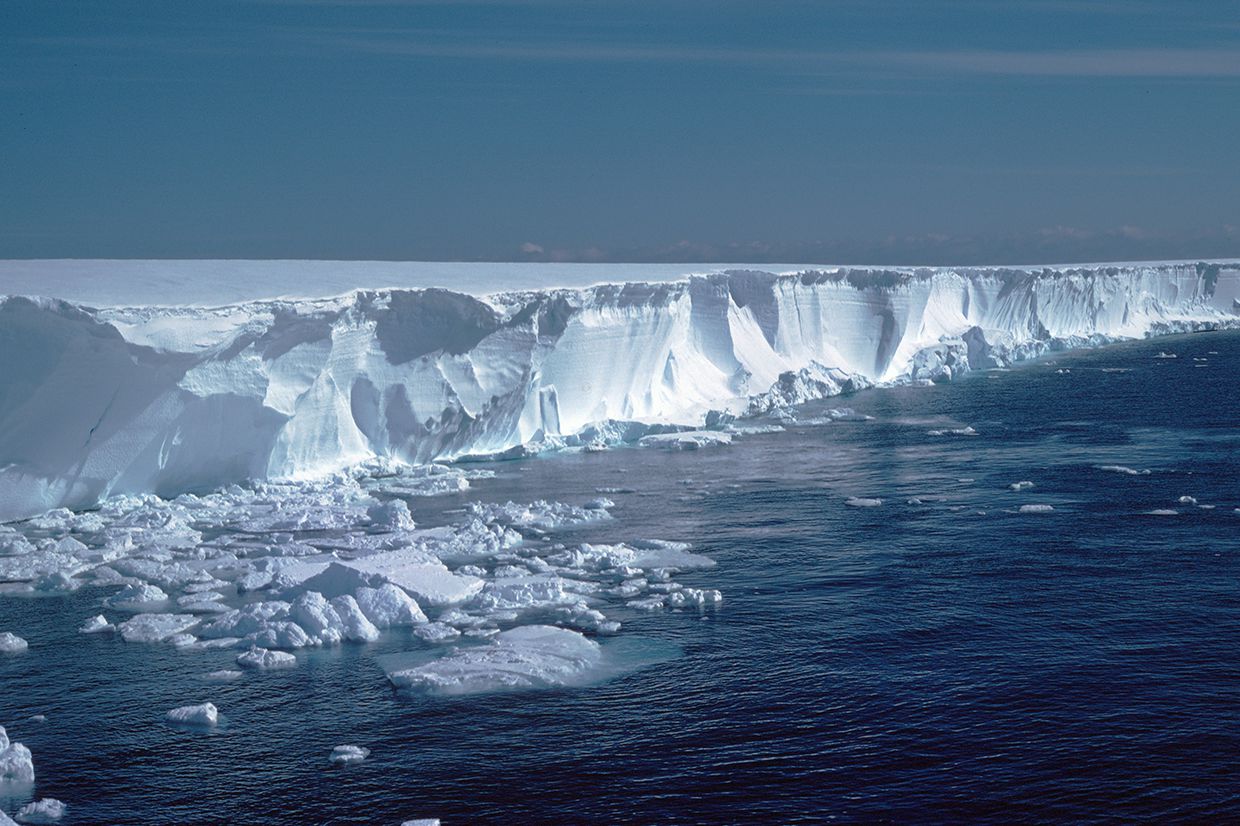
Ice Shelves
Ice shelves are the seaward extensions of glaciers, and are therefore made up of glacier ice. They can be hundreds of metres thick; and, because they are the floating part of larger glaciers, the ice within the ice shelves can flow at speeds of several hundred metres per year. Once glacier ice has reached the edge of an ice shelf, it eventually breaks off forming an iceberg. This process, termed ‘calving’, is the main form of glacier ablation in Antarctica.
There are a great variety of ice shelves of different sizes and thicknesses along Antarctica’s coast. As noted in Ice sheets and glaciation, the Ross Ice Shelf and the Ronne-Filchner Ice Shelf are the two largest. The size of an ice shelf is determined by the balance between accumulation and ablation. Although some snow may fall on the ice shelf, most of the accumulation is from the mass added to the ice shelf from the grounded glacier ice behind it. Ablation of the ice shelf occurs through melting due to contact with the sea (both along the edges of the ice shelf and beneath it) and by iceberg calving.
In recent years much research has been devoted to measuring the velocity of ice flow in ice shelves and mapping changes in their size and shape. This is because ice shelves are seen to be an important indicator of climate change in the South Polar Region. The ice shelves of the Antarctic Peninsula have been intensively studied because over the last 50 years the average air temperature in this region has increased by about 3°C, contributing to enhanced melting, retreat, and collapse of several of the ice shelves. The Larsen A Ice Shelf broke up dramatically over a matter of weeks in 1995, and Larsen B disintegrated in 2002.
The latest Larsen Ice Shelf to show signs of complete collapse was Larsen C. In the Climate of the Future page, we learnt how this large ice shelf in 2017 had an iceberg calve off which was the size of Luxembourg.
Since ice shelves float, they do not contribute directly to sea level rise as they melt and break up. However, they have an indirect effect because the removal of an ice shelf causes the grounded ice that was formerly buttressed behind it to flow with greater velocity towards the coastal ablation zone. As the grounded ice experiences increased ablation, this transfers more water from land to ocean, thereby causing sea level to rise.
The warming of the past 50 years has caused the limit of ice shelf viability to retreat southward along the Antarctic Peninsula; and if the warming trend continues, as seems likely due to increases in atmospheric greenhouse gases (see Climate change: past and future), more ice shelves will break up and increased ablation from land-based Antarctic ice will contribute more to the total eustatic rise in sea level.
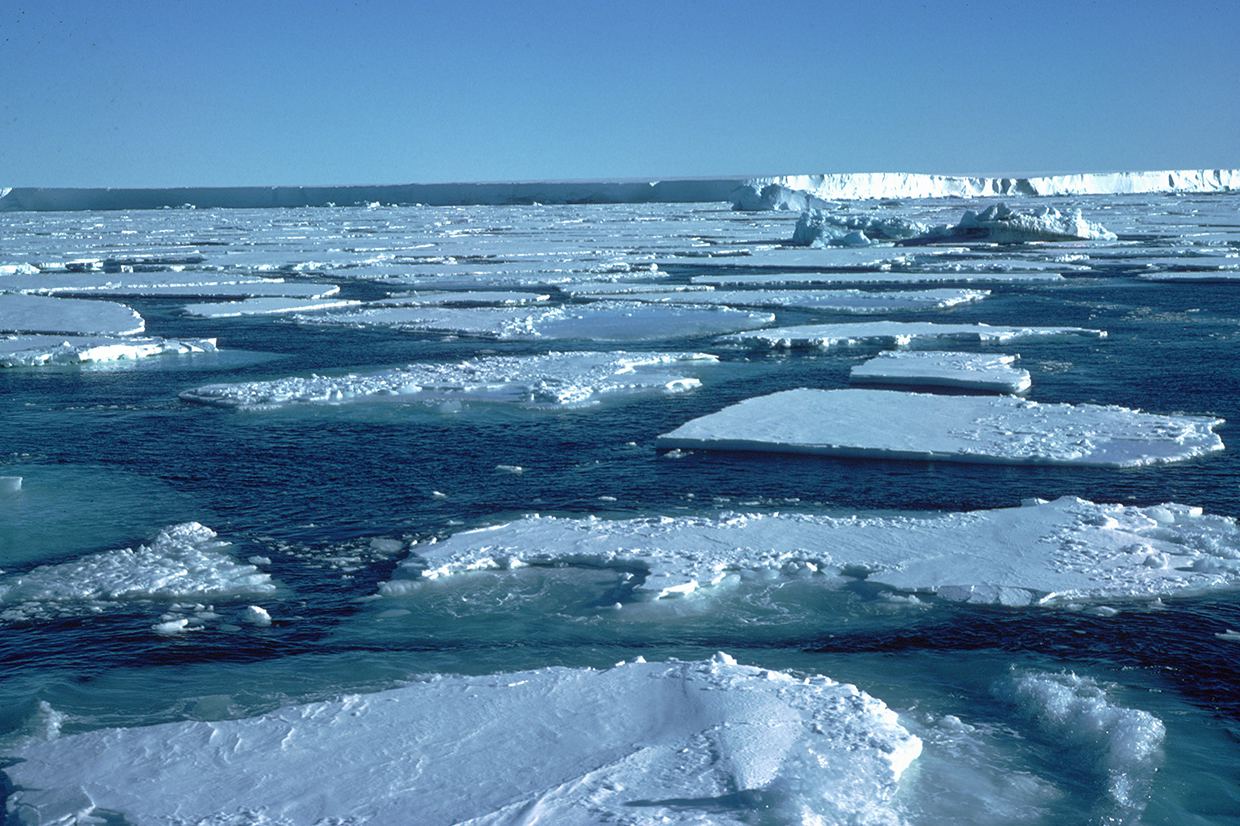
Sea Ice
In contrast with ice shelves, sea ice is frozen sea water that is usually only a few metres thick, and its extent varies greatly with the seasons. Because of the salinity of the ocean, freezing occurs at about -1.8°C; and as the sea ice forms, some salt is expelled thereby increasing salinity of surrounding water. Near the coast the sea ice is referred to as ‘land-fast ice’; whereas further out to sea where it can be moved by ocean currents and wind, it is termed ‘drift ice’. Large areas of drift ice are called ‘pack ice’. Around Antarctica, the area covered by sea ice expands from a low point of around 3 million km2 in February to about 20 million km2 in October (an area exceeding South America in size).
In contrast with the Arctic, where the extent and average thickness of sea ice has declined dramatically in recent years, the trend for sea ice in the Southern Ocean is less clear. However, with continued global warming, it is likely that sea ice will become less extensive in the Southern Ocean. This in turn would have implications for the south polar climate: the presence of sea ice makes conditions much colder than they would otherwise be, because of the increased albedo (reflection of sunlight) and the reduced ocean-to-atmosphere heat exchange that results when the ocean becomes capped by sea ice. A declining trend in sea ice extent has been observed for the area around the Antarctic Peninsula. Through positive feedback, this could lead to further warming in the region which would then reduce sea ice further.
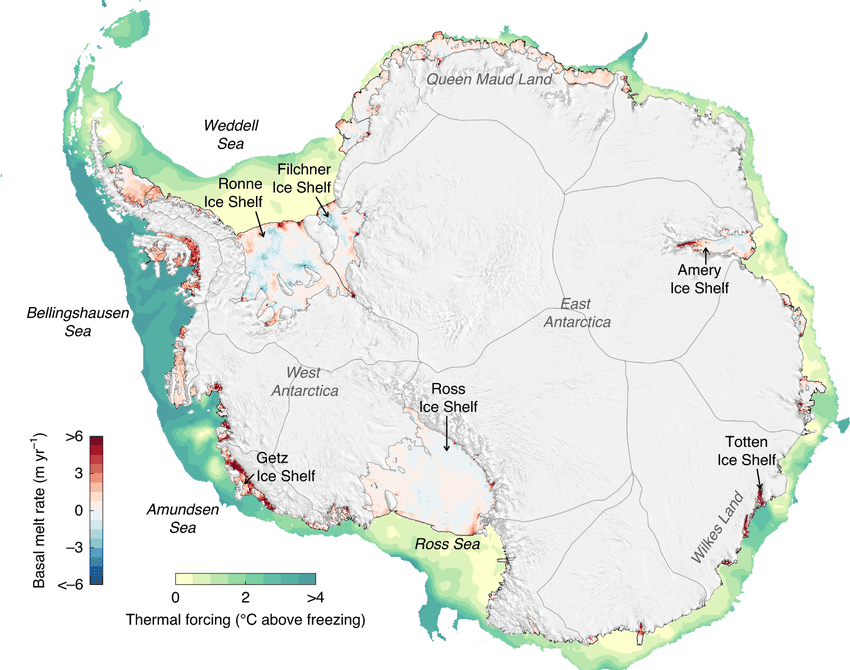
The basal melt rate of Antarctic ice shelves (the melting of the shelves from underneath) is in metres of ice equivalent per year, averaged over 2010–2018. Thermal forcing is the temperature above the freezing point of seawater. Both these rates are particularly high around the Antarctic Peninsula and the West Antarctic Ice Sheet.
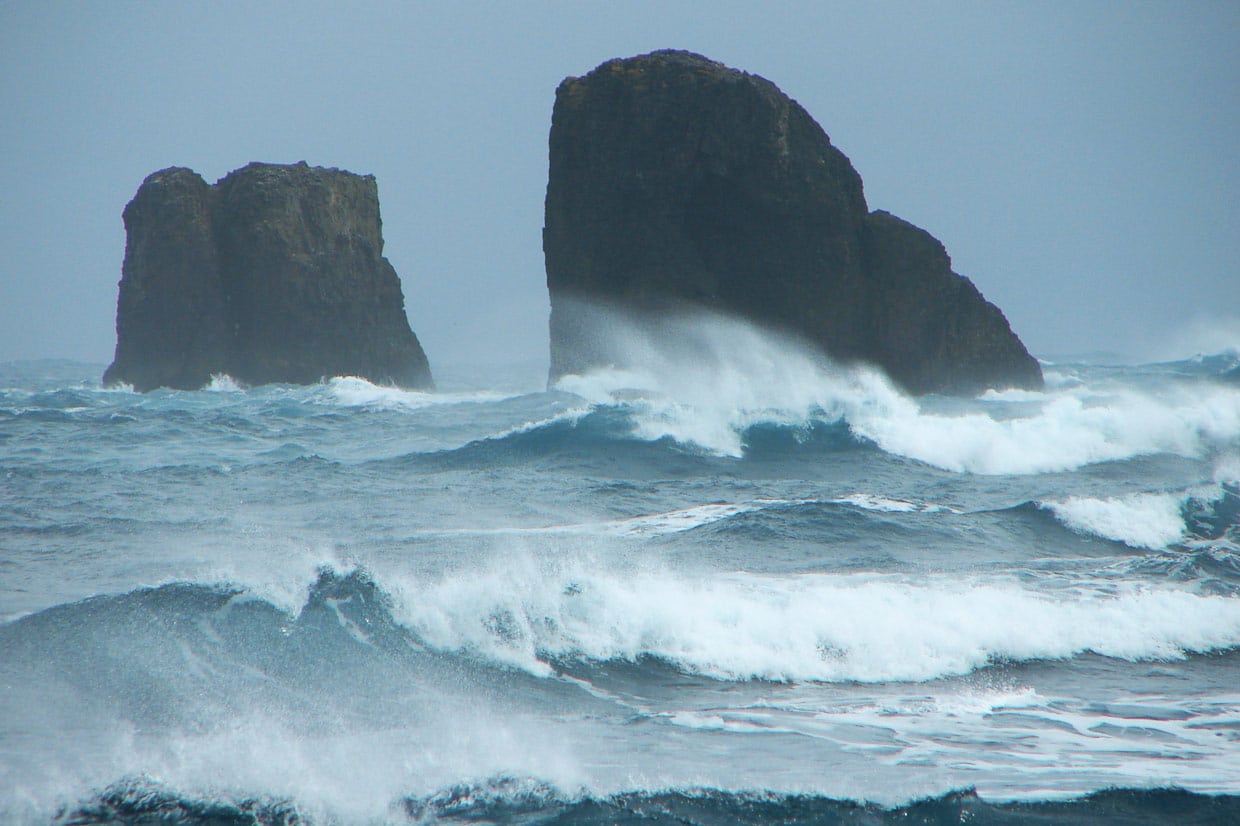
Antarctic Polar Front
The Southern Ocean encircles Antarctica, and its area is usually defined as extending from the edge of the continent (and its ice shelves) to the position of the ‘polar front’ separating it from the surrounding Pacific, Indian and South Atlantic Oceans.
This Antarctic Polar Front marks the location where there is a strong contrast in the temperature of the sea water: the Southern Ocean water is significantly colder than the waters of the surrounding oceans. These differences can be as extreme as -1.8°C near Antarctica to about 3.5°C near the polar front.
The polar front boundary is relatively stable in its position through the year, but the latitude at which it is found varies around the continent. For instance, the frontal boundary between the Southern Ocean and the South Atlantic is located at around 50°S; whereas the boundary with the Pacific Ocean is in places more than 60°S. The Antarctic Polar Front itself is a narrow zone, about 40km wide, across which sea surface temperatures rise by 2 to 3°C. According to this way of defining the Southern Ocean, its area is 31.8 million km2, constituting nearly 9% of the Earth’s total ocean area.
Circulation of the Southern Ocean
There are two types of ocean currents in the Southern Ocean that are fundamental to understanding the ocean’s characteristics, climate and ecology: the clockwise Antarctic Circumpolar Current and the formation of Antarctic deep water.
The Antarctic Circumpolar Current is the biggest ocean current in the world, transporting some 3 million km3 of water around the continent annually. It arises because of the strong and consistent prevailing westerly winds in the southern mid- to high-latitudes. Unlike in the Northern Hemisphere, the mid-latitude westerly winds are not impeded by large land masses and areas of high relief. There is also a stronger pressure gradient from the mid- to high-latitudes in the Southern Hemisphere due to the cold climate of Antarctica. This causes the westerly winds to reach a higher velocity and to move in a more straight (or zonal) fashion from west to east around Antarctica, causing surface water to do the same. With the surface water circling around the continent, there is less scope for warmer water from the surrounding oceans to bring its heat near the continent. The oceanic polar front is also maintained as a strong thermal boundary between cold southern water and warmer mid-latitude water.
Antarctic deep water (also known as Antarctic Bottom Water or AABW) forms when surface water reaches a temperature and level of salinity that makes it denser than surrounding water. The water then sinks to the bottom of the ocean and moves away from the Antarctic continent into the other oceans. The salinity of surface water (and hence density) increases because salt is expelled during the process of sea ice formation. As a lot of sea ice forms in the Weddell and Ross Seas (and the water gets very cold) these are the main areas for the formation of AABW. The water forming AABW is more dense than any other water mass in the world, and it is an important component of a much larger, global-scale circulation system known as the ‘great ocean conveyor’.
This conveyor system is also referred to as the ‘thermohaline circulation’ because of the role of both temperature and salt in creating sea water masses of different densities. The thermohaline circulation is important for the world’s climate because it causes warm and cold masses of water to move around the globe and to redistribute heat. In the North Atlantic, the formation of North Atlantic Deep Water (NADW) is critical for keeping the British Isles (and the rest of north-west Europe) more mild in winter than would otherwise be the case, considering Europe’s latitude. As the NADW forms and sinks, surface water from lower latitudes moves northward to replace the descending water – this increases sea surface temperatures in the North Atlantic which in turn contributes warmth to the atmosphere. AABW and NADW are the two major deepwater masses in the world. You can see diagrams and learn more about the global thermohaline circulation system by clicking on these links:
Maps
Student activity 1
Use an atlas, or the web links listed below, to locate and label the major ice shelves of Antarctica. Download and print the base map of Antarctica.
Websites showing location of ice shelves:
Document showing the location of Antarctic Peninsula ice shelves:
Maps
Student activity 2
Use an atlas, or the web links listed previously, to locate and label present and former ice shelves of the Antarctic Peninsula, can you find the Larsen C ice shelf? Download and print the base map of the peninsula.
Analyse
Student activity 3
Download this spreadsheet which contains data of the real coverage of Antarctic Peninsula ice shelves measured at different time periods:
-
Changes in the area covered by Antarctic Peninsula ice shelves (excel)
3a Copy the data into your own spreadsheet and do the following:
-
Create a column that shows the area (km2) lost for each ice shelf between the first and second periods of measurement.
-
Create another column that shows the percentage of the original area remaining for each ice shelf.
-
Calculate the total ice shelf area that has been lost from the Antarctic Peninsula between the measurements shown.
-
Create an appropriate graph to illustrate how the percentage area decline compares between the different ice shelves. Organise the graph so that the ice shelves are shown in order of their latitudinal location along the peninsula.
3b Referring to the graph, to what extent does ice shelf retreat relate to location along the Antarctic Peninsula?
3c Write a paragraph or two that summarises the current state of ice shelves in the Antarctic Peninsula and that considers what is likely to happen in the future if temperatures continue to rise.
