

Regional climate variation and weather
In what ways does the climate vary across Antarctica and why? What weather phenomena occur in different parts of the continent?
Warm up
There are large variations in climate across the continent owing mainly to differences in latitude, altitude, and distance from the Southern Ocean. The Antarctic climate as a whole can be discussed in terms of three different climate areas: the interior climate, the coastal climate and the climate of the Antarctic Peninsula.
The coldest and driest areas are inland, where the ice sheets form high plateaux (exceeding 4000m altitude on the East Antarctic Ice Sheet). In these areas, extremely cold air descends to create persistent high pressure that brings settled conditions with relatively low wind speeds. Temperatures during the austral summer rarely exceed -20°C and during the winter months temperatures are often around -60°C. Precipitation is usually snow in the form of ‘diamond dust’ – tiny ice crystals formed from the sublimation of water vapour in a clear, but intensely cold atmosphere – averaging less than 50mm (water equivalent) per year.

Near the coast there is greater seasonal variation in temperature, and in the austral summer, temperatures can warm to around 0°C. Due to the lower altitude and latitude the air is warmer than inland, so enabling it to hold a lot more water vapour; and in addition, storm systems from the Southern Ocean have more influence. Hence, annual precipitation is much higher than inland, reaching levels of around 400mm in some coastal locations, and skies are often cloudy. Precipitation is almost always in the form of snow, with rain only falling extremely rarely in some areas in the summer months. Winds can reach high velocities in areas near the coast due to topographic factors and the phenomenon of katabatic winds discussed further below.
The Antarctic Peninsula extends into the Southern Ocean and is therefore more influenced by the sea than other parts of the continent. Annual precipitation varies greatly across the Peninsula, with some areas receiving as little as 250mm water equivalent, and other areas as much as 5000mm. Near the tip of the peninsula (which lies outside the Antarctic Circle) summer temperatures often rise a little above freezing.
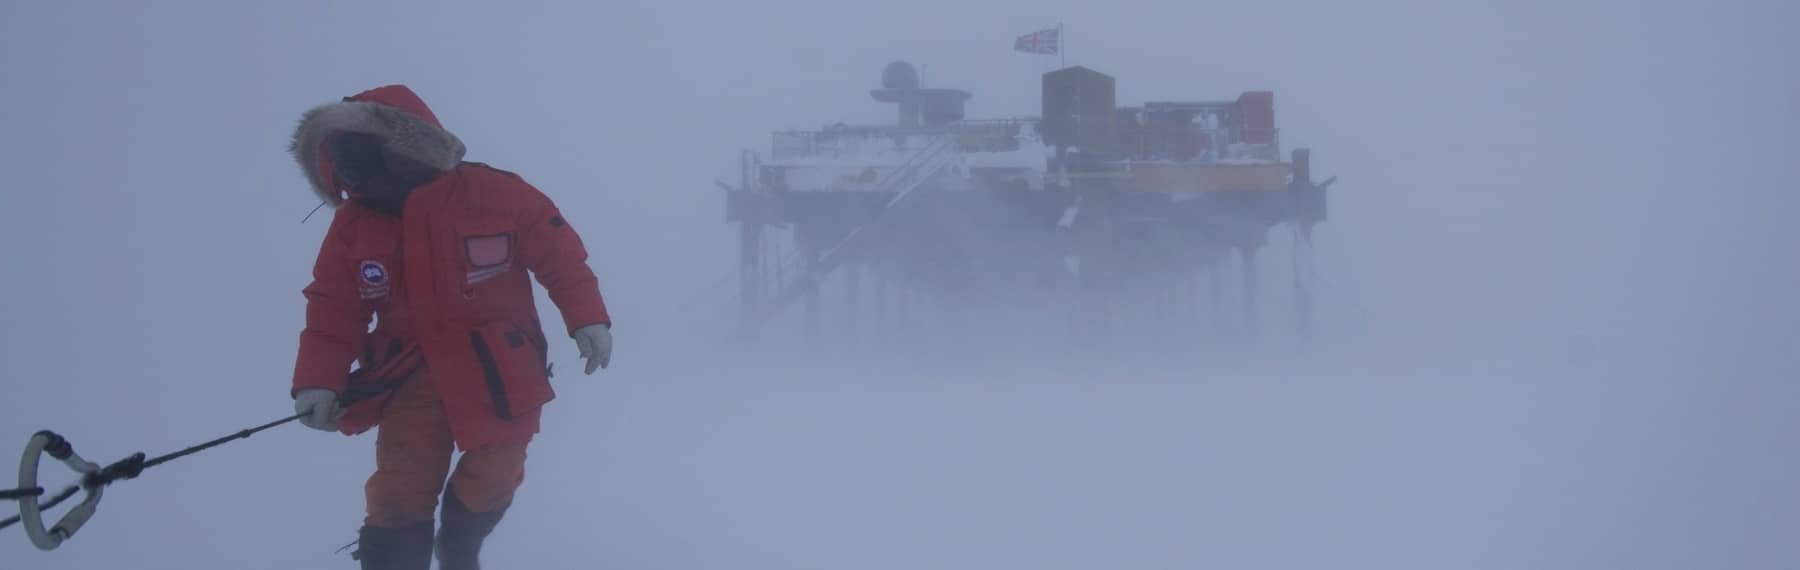
The harsh weather of Antarctica makes living and working there a real challenge. Learn about how Antarctic scientists dress for the weather in the activity below:
Cold Facts
Regional measures of temperature and precipitation
Compared with other continents, places in Antarctica where the weather is measured regularly are few and far between (although the placement of automatic weather stations and satellite-based weather measurements are improving coverage of the continent). Of the weather stations that exist, most have relatively short records. As noted in Key factors behind Antarctica’s climate, strict conditions need to be met for weather recordings to be classed as ‘official’ for statistical purposes, and climatologists like to base any statements about the climate of an area (the ‘average weather’ experienced at a locality) on at least 30 years of data (the ’30 year mean’). There are, however, some stations in Antarctica that meet these stringent requirements and allow scientists to build up a picture of how temperature, precipitation, and other climate measures vary across the continent. A few stations have records extending back well beyond 30 years, and these stations are crucial for studies of climate change as described in Climate change: past and future.
Important stations where weather is recorded in the interior of the continent include the Amundsen-Scott station (USA) at the South Pole and the Vostok station (Russia) in East Antarctica. Both stations were established in 1957 as part of the International Geophysical Year. The Amundsen-Scott station is at an elevation of 2900m above sea level and the Vostok station is at 3500m. In addition to being very cold, these stations also represent the extreme of the polar desert climate with very low levels of humidity and precipitation. Weather conditions characteristic of coastal areas of the continent are represented at Halley station (UK) bordering the Weddell Sea, which has been in operation since 1956 and McMurdo station (USA) bordering the Ross Sea, also started in 1956. Also on the coast, the Mawson station (Australia) was set up in 1954 and is the oldest continuously occupied station inside the Antarctic Circle. This station is also notable for the force of the katabatic winds (explained below) that come down off of the high ice sheet: gusts of wind here can sometimes be over 100mph. The Rothera station (UK) provides data on the climate of the Antarctic Peninsula. It is located on the west side of the peninsula at Rothera Point on Adelaide Island and has been in operation since 1975. Peninsula weather recordings have been taken over a longer period of time at Vernadsky station (Ukraine) which was previously a British station called Faraday (the climate data are sometimes referred to as being from Faraday/Vernadsky). There are also other stations along the Peninsula, notably the Palmer station (USA) and the San Martin station (Argentina). There are stations on several islands off the coast of Antarctica that provide data on the weather and climate of the Southern Ocean, for example Signy station (UK) on Signy Island in the South Orkney Islands, first occupied in 1947. Data from a selection of stations are contained in the spreadsheet attached to Student activity 2 below.
Find out the current weather conditions at various stations at:
Winds
The dominant pattern of atmospheric circulation over Antarctica involves cold air sinking in the interior and then moving away from this area of high pressure towards the edges of the continent. The air that sinks down onto the interior is replaced by air from aloft that has travelled southwards at a higher altitude. This large-scale circulation of air is often referred to as the polar cell. (There is also a polar cell in the Arctic.) As air from the interior moves outwards across Antarctica, it doesn’t travel directly from south to north. Instead, the direction of the air is deflected by the Earth’s rotation to form polar easterlies, meaning that the prevailing wind direction is from east to west across much of the continent. This occurs because the Coriolis Force causes air to be deflected to the left of its ‘pressure gradient path’ (the most direct route from high to low pressure) in the Southern Hemisphere.
Where these easterly winds approach the coast they can reach high velocities. A katabatic wind refers to cold and relatively dense air near the surface moving downhill due to gravity. Across much of the gently sloping ice sheet katabatic winds average about 10 miles per hour; but towards the edges of the continent, slope gradients become steep and air can be funnelled down into coastal valleys causing much higher average velocities. In some places the average annual wind velocity is nearly 50 miles per hour!
Moving northwards, away from the continental interior, the polar easterlies eventually give way to the zone of westerly winds affecting the Southern Ocean. The westerly winds are associated with the low pressure area (circumpolar trough) that surrounds the continent owing to the large temperature difference between cold polar air and milder air from the southern mid-latitudes. The circumpolar trough exists because where warmer air meets the cold polar air (along the polar front) the warmer air is forced upwards, creating lower pressure at sea level and the frequent storm systems that affect the Southern Ocean. Air moving from the mid-latitudes towards the circumpolar trough is deflected to the left by the Coriolis force thereby producing the westerly prevailing winds. The westerly winds and Southern Ocean storm systems affect parts of the Antarctic coastline, the Antarctic Peninsula, and the islands off the coast of Antarctica.
Other weather phenomena
Antarctica is also known for several intriguing types of atmosphere and weather phenomena.
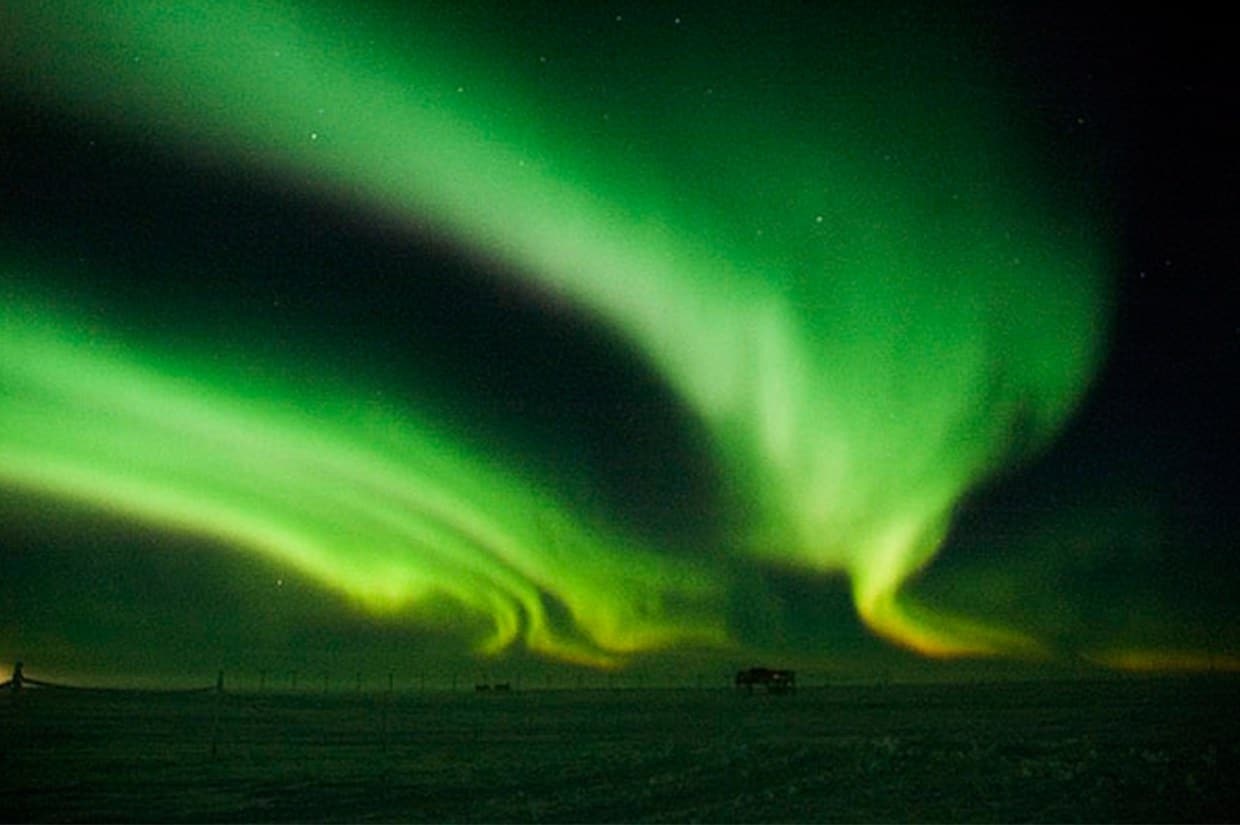
Aurora Australis
Known as the Aurora borealis in the Northern Hemisphere, this spectacular phenomenon is often described as waving or shimmering curtains of light across the night sky. It is caused by charged particles from the Sun being pulled towards the Earth’s magnetic poles and interacting with gases high in the atmosphere to illuminate the night sky.
Diamond dust
This occurs when water vapour sublimates directly out of the cold atmosphere to form ice crystals, creating a form of precipitation that occurs under clear skies.
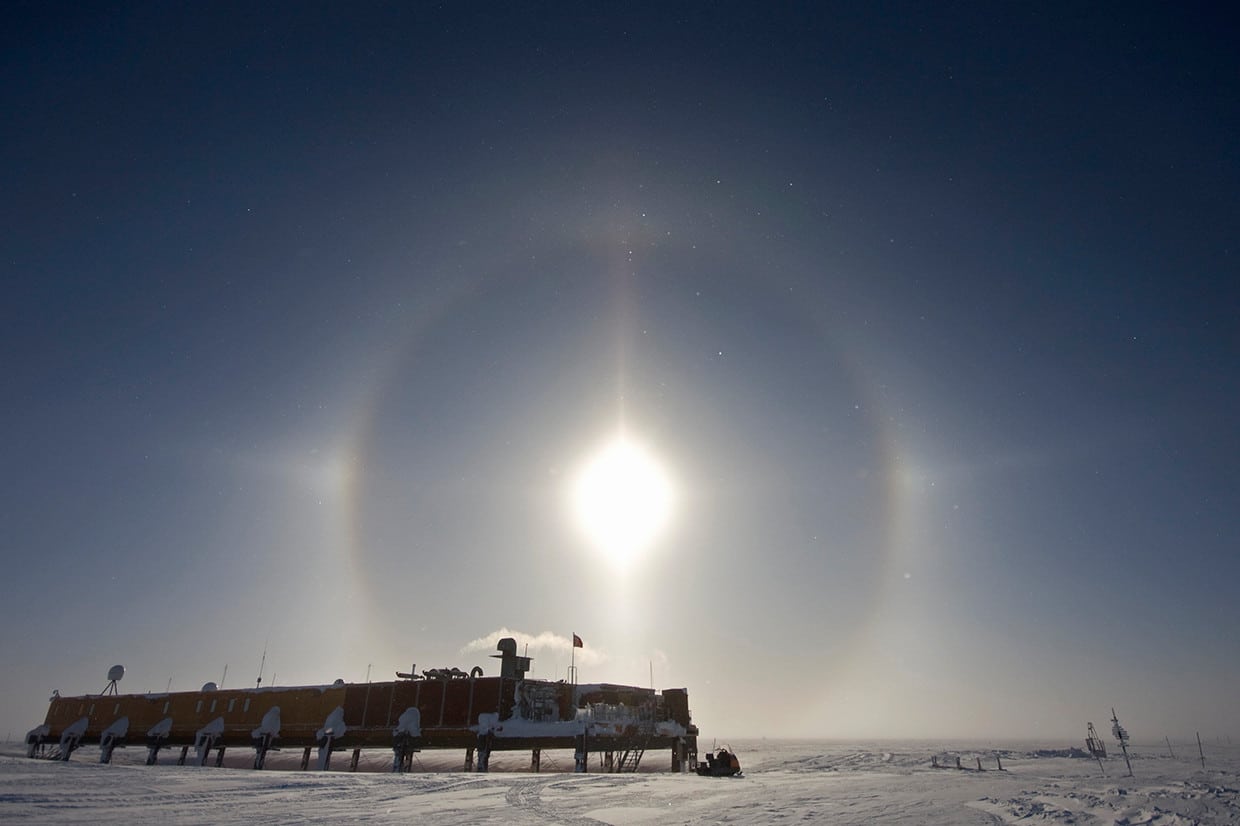
Halo
This optical phenomenon occurs frequently in Antarctica because of ice crystals in the atmosphere that reflect and refract light. Halos are typically rings of light circling the Sun or Moon, but they can also appear as pillars and arcs of light.
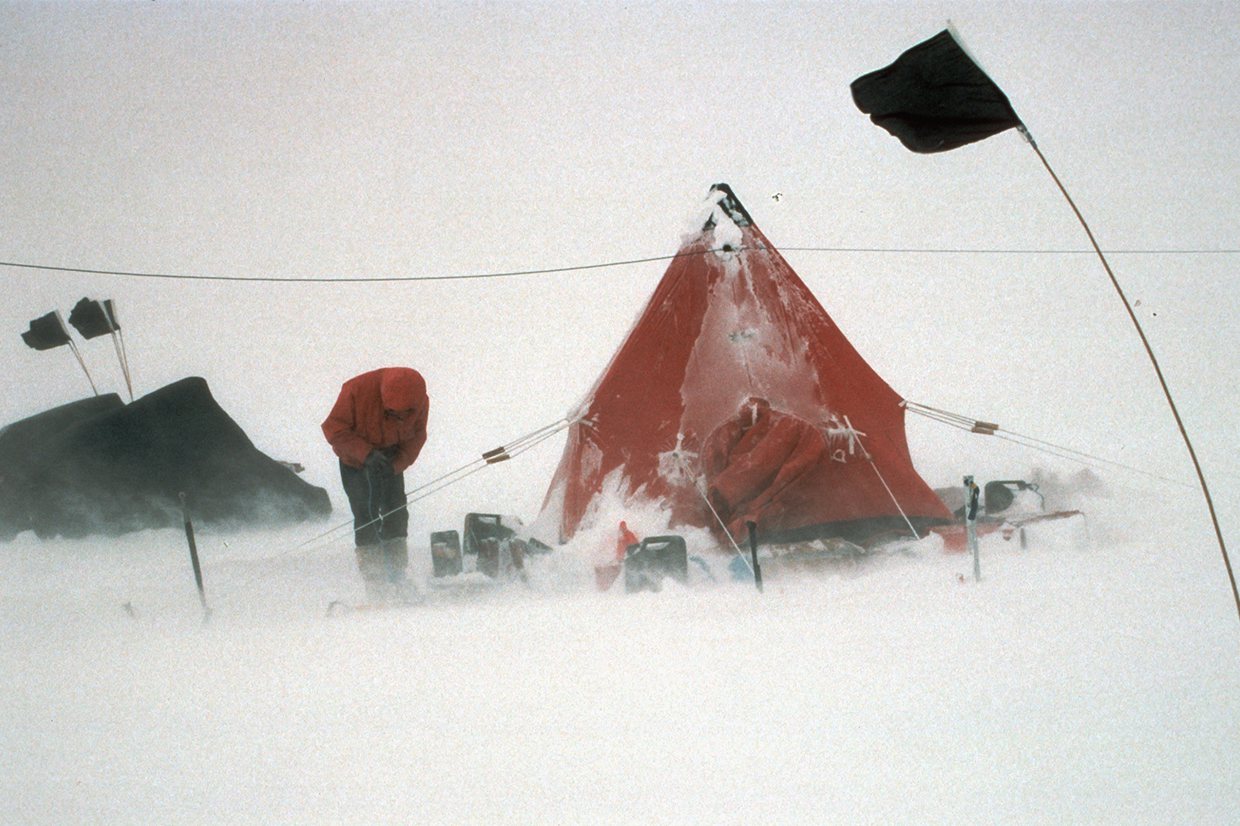
Whiteout
Under whiteout conditions, it is difficult to judge distances, perceive gradients or make out the horizon. Whiteouts can occur under different weather conditions (for example blizzards or calm, overcast conditions) where light is diffuse and it is hard to distinguish the surface from the sky.
-
You can learn more about Antarctic weather phenomena by visiting the British Antarctic Survey website.
Student activity 1
Location of Research Stations
Use an atlas and/or the following links to annotate a base map of Antarctica to show the location of the Antarctic research stations listed below.
-
Gisdata (Note: at this GIS programme site you can search by key words or place names by clicking in the ‘Query’ box on the binoculars icon. A drop down box will appear showing any locations that include the search term that are within the map data base. Click on the desired location and it will appear on the map. You might have to use the magnifying glass icons to zoom in to see the selected location.)
-
Download the base map.
| Station name | Latitude/longitude | Altitude above mean sea level |
| Amundsen-Scott South Pole (USA) | 90°S | 2835m |
| Byrd (USA) note – station closed in 2005 | 80°01’S,119°32’W | 1515m |
| Casey (Australia) | 66°17’S,110°31’E | 42m |
| Davis (Australia) | 68°35’S,77°58’E | 18m |
| Dumont d’Urville (France) | 66°40’S,140°00’E | 43m |
| Halley (UK) | 75°35’S,26°34’W | 30m |
| Mawson (Australia) | 67°36’S,62°52’E | 10m |
| McMurdo (USA) | 77°51’S,166°40’E | 24m |
| Palmer (USA) | 64°46’S,64°03’W | |
| Rothera (UK) | 67°34’S,68°08’W | 32m |
| San Martin (Argentina) | 68.°07’S,67°06’W | 5m |
| Signy (UK) | 60°43’S,45°36’W | 6m |
| Vernadsky (Ukraine) | 65°15’S,64°16’W | |
| Vostok (Russia) | 78°27’S,106°51’E | 3490m |
Student activity 2
Working with spreadsheet data
2a The attached Excel spreadsheet contains weather data for some of the weather stations listed above.
Copy the data attached here into your own spreadsheet and do the following:
-
Choose a selection of stations from the spreadsheet that represent a range of locations and elevations across Antarctica.
-
Draw climate graphs for the selected stations. (Months of the year along the X-axis, weather variables along the Y-axis.) Plot mean monthly temperatures as points connected by a line, and (where data are available) plot mean monthly precipitation as bars for each month. (Hint: you need two Y-axis scales if plotting both temperature and precipitation.)
-
Where data are available, draw separate climate graphs to show mean monthly wind velocity.
-
For each station chosen, calculate the mean annual temperature, the total annual precipitation (where data are available), and the mean annual wind velocity. Also identify the maximum and minimum values for each variable, and calculate the annual ranges.
2b Write short paragraphs to describe the nature of the climate at each selected station. (Abbreviated descriptions can also be added on to your Antarctica base map next to the relevant research station.)
2c Identify the station on the spreadsheet with the lowest mean annual temperature. What factors cause this station to be the coldest in Antarctica?
2d Identify the station on the spreadsheet with the highest average windspeed. What factors cause strong winds here?
Student activity 3
Write a short essay to explain the differences in climate seen between the different stations. Discuss a variety of different weather variables and consider factors such as latitude, altitude, and proximity to the Southern Ocean in your essay.
