

Climate change: past and future
How has Antarctica’s climate changed in the past? Is Antarctica being affected by ‘global warming’ and how might we expect its climate to change in the future? What evidence is needed to address these questions?
Warm up
The cause of human-induced climate change (commonly referred to as global warming) is now well known. Concentrations of greenhouse gases in the atmosphere (notably carbon dioxide and methane), are now well above their pre-industrial levels. These increases are from a range of different sources including increased use of fossil fuels (coal, oil, and natural gas), deforestation, and increased agriculture. More greenhouse gases in the atmosphere means more heat energy is trapped within the Earth’s atmosphere instead of escaping back out to space, causing the planet to warm.
Greenhouse gases are not the only factor which influence the Earth’s climate. Climate varies naturally over different timescales, and the way in which greenhouse gasses (both natural and human-induced) interact with the climate system changes on different timescales as well. This makes understanding the climate system quite complex and requires understanding more about the natural climate processes.
By looking back in time (hundreds of thousands of years) to the climate system before human activity began provides a great opportunity to learn about the climate system in its natural state. Studies of Antarctica have played a crucial role in this, as the continent has been collecting ice in layers for millions of years and provide hidden clues about the climate system in the past. This has allowed scientists to understand far better natural climate variability.
Studying climate in the polar regions is really important as they are exceptionally responsive and sensitive to changing conditions, often described as the ‘canary in the coal mine’ for detection of global warming. Some of the research stations discussed in Regional climate variation and weather, provide important weather data for assessing the polar response to the rise in greenhouse gases. Antarctica’s response to climate change is really important as it holds about 90% of all the ice on the planet, what happens in Antarctica will have major effects on the rest of the world.
Before looking further at what we have learned about climate change from Antarctica, it’s worth reviewing some key concepts about evidence and timescales.
Climate change, past and future warming
Evidence from fossils, ice cores and weather recordings in Antarctica

Cold facts
Past climate change in Antarctica: the evidence in ice
Antarctica hasn’t always had the same climate that it has today. In the geological past (many millions of years ago), Antarctica has been much warmer than present, and fossils found in rocks indicate that at various times even trees have covered much of the continent. These warmer periods in Antarctica were the result of different tectonic configurations and patterns of ocean circulation many millions of years ago (see Key factors behind Antarctica’s climate). However, for at least the last 6 million years, ice has covered most of the continent.
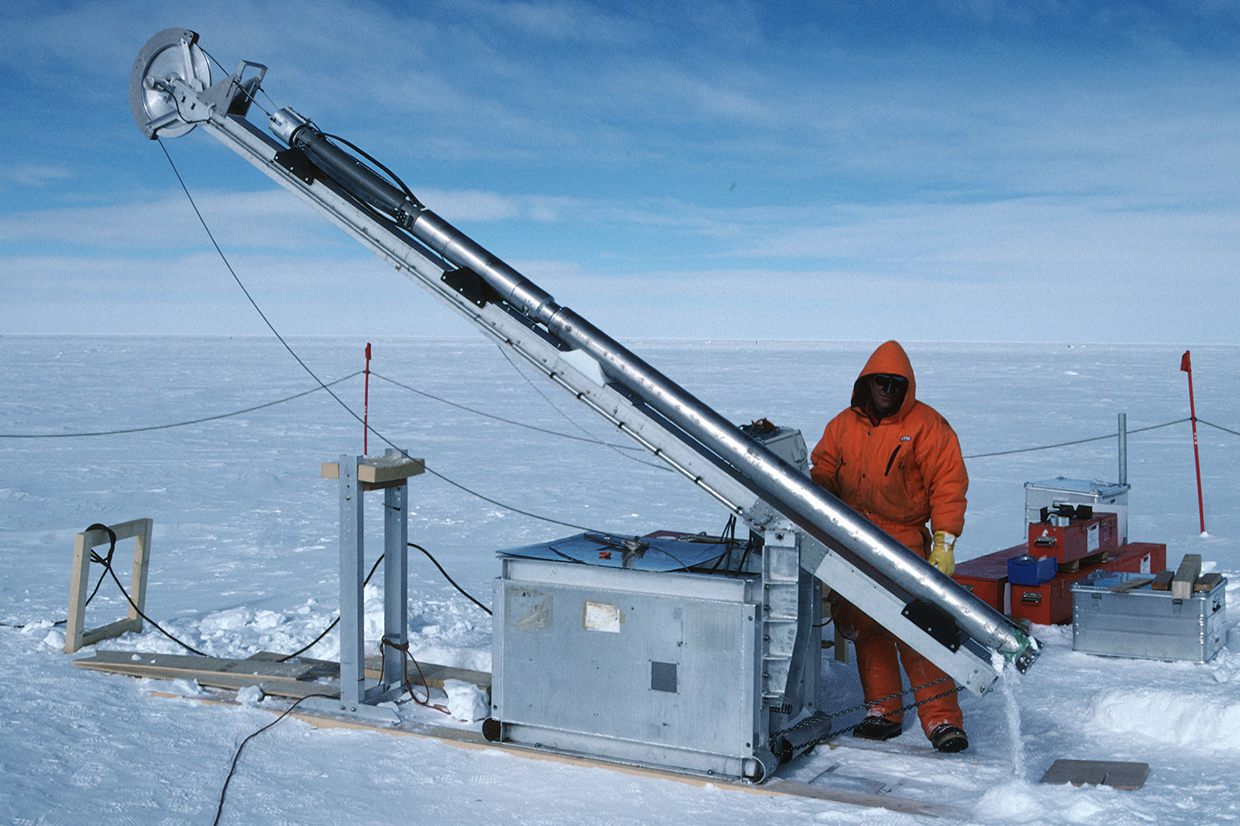
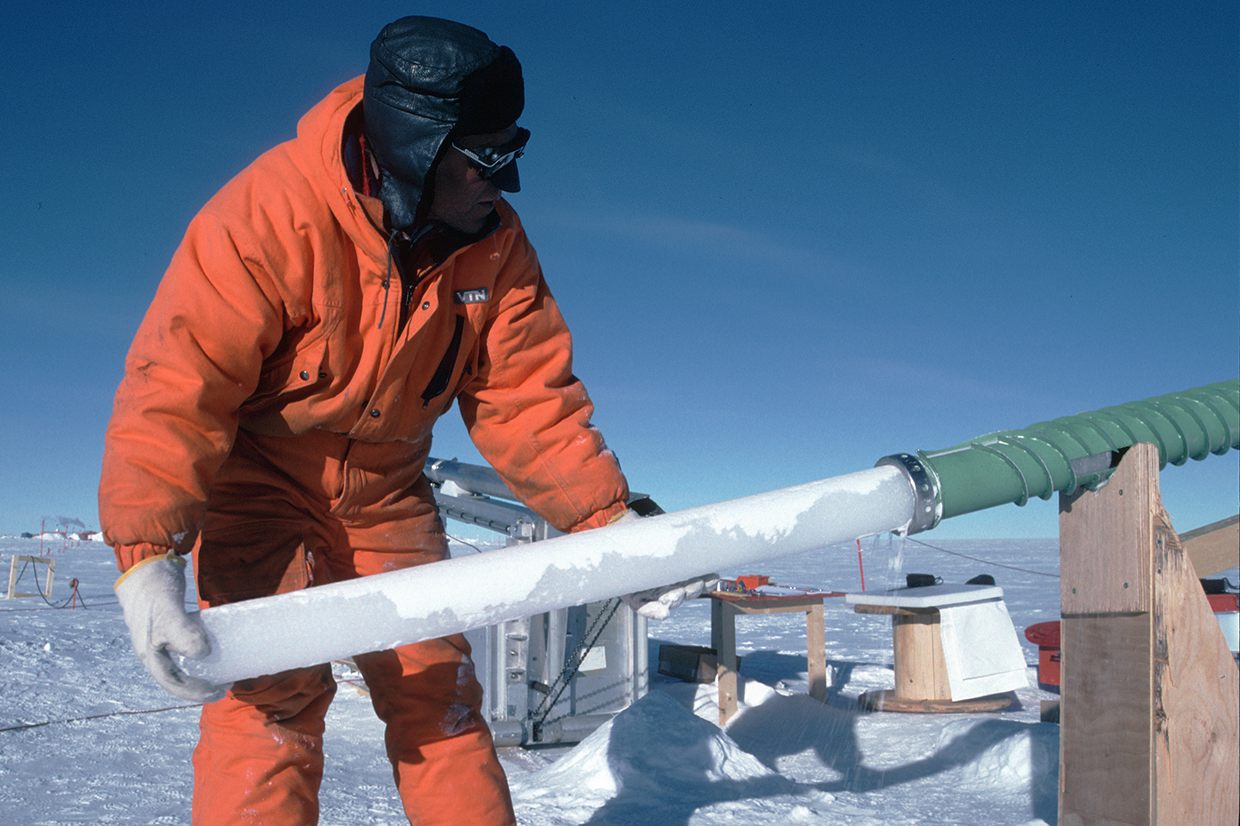
To look at climate changes over the last approximately 2 million years, ice cores are used instead of the geological record. Ice cores are obtained by drilling into an ice sheet or glacier and extracting cylindrical sections of ice. These sections of ice represent many thousands of years of snow accumulation: the addition of snow each year buries underlying layers of snow, and over time these layers become compressed into glacier ice. Each layer of an ice core is derived from snow that fell at a certain time in the past, and each layer is like a time capsule, containing information about what the atmosphere was like at the time the snow fell.
Recently, a new ice core from Antarctica’s eastern ice sheet has been found to record changes in the Earth’s atmosphere for the last 2.7 million years. This is the oldest ice core every recorded. Over this period, both landmasses and oceans have been in the same position as they are today. Therefore, the changes recorded in Antarctic ice are more informative about how the climate varies under the present tectonic configuration and how it may change in the near future.
Watch
a video about ice cores
Watch a video showing the extraction of an ice core
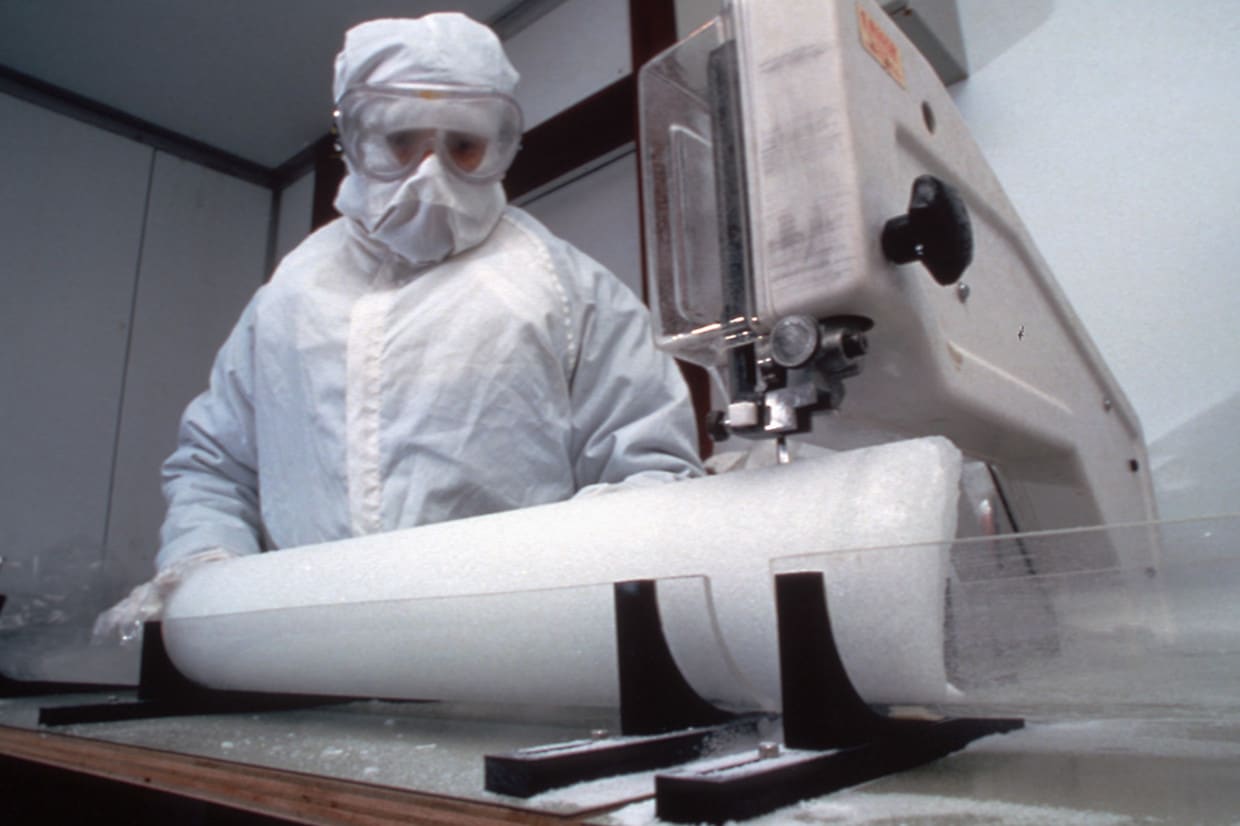
The evidence in ice cores
The beauty of ice cores is that they contain a variety of forms of evidence that can tell us so many different things about the past climate and environment. The evidence is also continuous through time and can be dated with a high degree of precision. Some important types of evidence and information are:
- Stable isotope ratios of the oxygen and hydrogen making up layers of ice are used to reconstruct the air temperature at the time that the snow fell.
- Where annual layers of ice can be identified, the thickness of layers indicates the yearly quantity of snowfall in the past.
- The concentration of dust preserved in layers of ice gives an indication of how much wind erosion was occurring on continents in the past (related to both the strength of winds and the levels of vegetation cover over the land in the past).
- Tephra shards and levels of acidity of the ice show when major volcanic eruptions happened in the past.
- Air trapped inside the ice can be analysed for its concentration of carbon dioxide and methane, indicating how concentrations of these greenhouse gases in the atmosphere have fluctuated through time.

The basic idea behind the interpretation of stable isotopes in ice cores is that as air cools and condensation occurs, the heavier isotopes of hydrogen and oxygen will condense out more readily than the lighter isotopes. This means that the colder the air is, the more depleted the water vapour will be in heavy isotopes; so when precipitation forms, the H2O added to the ice sheet is ‘light’ (e.g. the ratios of 18O to 16O and 2H to 1H will be less). Conversely, as the atmosphere over the ice sheet warms, there will be an increase in the ratio of heavy to light isotopes.
These ratios are expressed as per mille (rather than per cent), and they are measured in relation to ‘standard mean ocean water’ (SMOW). Because H2O with the lighter isotopes is evaporated more easily from the ocean, the isotope ratios of water vapour in the atmosphere (and hence precipitation reaching an ice sheet) are always negative in relation to SMOW. For example, oxygen isotope ratios from the Byrd ice core, West Antarctica, range between -33o/oo and -43o/oo. Because there is a shift of about a 0.7o/oo for every 1°C change in mean annual air temperature, the Byrd ice core shows temperature fluctuations on the order of 15°C over the past 100 000 years.
You can find out more about ice coring, about the interpretation of stable isotopes in ice cores, as well as about how other forms of evidence are analysed and interpreted, by viewing these websites:
-
NOAA: Paleoclimatology Slide Sets (view the Polar Ice Cores slideshow)
Contributions of the Antarctic ice cores
Ice cores have been extracted from many glaciers and ice sheets around the world. Much of the pioneering work was done on Greenland ice; and, due to the higher snow accumulation rates on Greenland compared with Antarctica, the Greenland ice cores provide a more finely resolved record of change (with annual layer counting extending back to roughly 40 000 years ago). However, Greenland ice cores do not extend back much beyond 100 000 years, and the presence in the ice of wind blown carbonates from Canada contaminates past CO2 measurements. Hence the major ways in which Antarctic ice adds to the knowledge gained from Greenland are:
-
The time span covered by Antarctic ice is much longer.
-
Antarctic ice provides a long record of atmospheric CO2 concentrations that is unavailable from Greenland ice.
-
The Antarctic record provides information about changes in the Southern Hemisphere that can be compared with what we know about changes in the north.
There are three main areas of Antarctica that have supplied long ice cores. The longest ice core record (extending back approximately 2.7 million years) was taken from the Allan Hills area of East Antarctica back in 2017. Previously the longest record was the EPICA ice core, also from East Antarctica extending back 800 000 years. Another important core, analysed in the 1990s, was taken from the Vostok station, also in East Antarctica. The Vostok ice core provides climate information extending back to about 400 000 years ago. West Antarctica is represented by the Byrd ice core record that was drilled to a depth of 2037m.
Antarctic ice cores have contributed a great deal to our understanding of climate change, particularly in the following ways:
-
Over the past several hundred thousand years, fluctuations in mean annual surface air temperature over Antarctica have exceeded 10°C.
-
The long timescale Antarctic temperature fluctuations correlate with the pattern of glacials and interglacials that affected the Northern Hemisphere. (Today we live during an interglacial (warm) time called the Holocene in which there is relatively little ice in the Northern Hemisphere compared to what has been usual over the past 2.6 million years (the time span of the Quaternary Period)).
-
The levels of carbon dioxide and methane in Antarctic ice cores correlate with the pattern of cooling and warming associated with glacials and interglacials.
-
Analyses of carbon dioxide and methane in the ice cores show that the present concentrations of these greenhouse gases in the atmosphere are higher than at any time spanned by the ice core record.
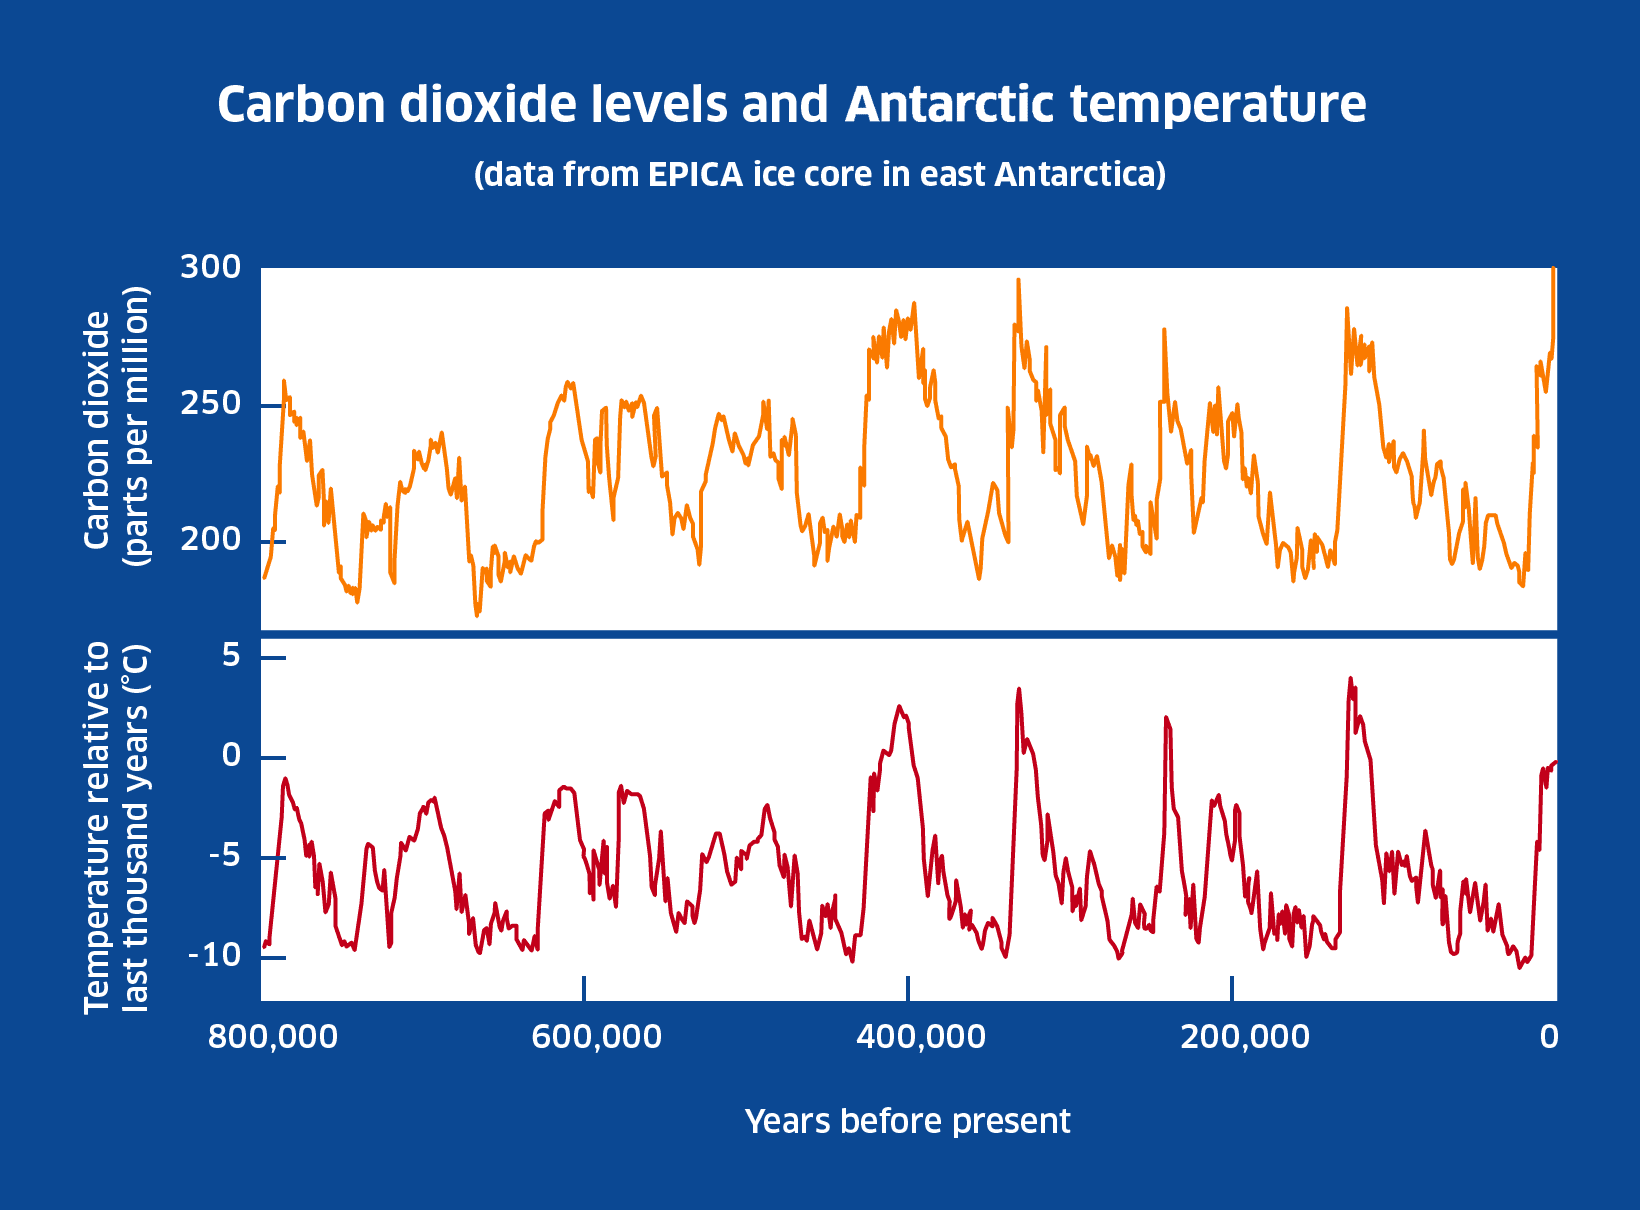
The diagram below summarise these major insights:
The Ice Age and glacial/interglacial cycles
The long term Antarctic temperature changes derived from the analysis of stable isotopes relate to the natural climate variations associated with the cycles of glacial expansion and retreat during the Quaternary Ice Age (glacial/interglacial cycles). On average, the cold, glacial phases last considerably longer than the interglacial phases during which warm conditions are sustained for around 10 000 years (our current interglacial has so far lasted for 11 700 years). Also notice from the EPICA diagram that the amplitude of warm/cold oscillations increased about 400 000 years ago. In addition to the temperature changes, these cycles were accompanied by large changes in sea-level (during the last glacial maximum sea-level was about 120m lower than now); and these sea-level changes were the result of changes in the total amount of ice on land (both in the Northern Hemisphere and in Antarctica).
You can learn more about the Ice Age and about glacial/interglacial cycles by visiting these websites:
-
NOAA: Paleoclimatology Slide Sets (view the Ice Age slide show)
Importantly, the concentrations of carbon dioxide, and other greenhouse gases, track the temperature changes very closely. While the pacing of these natural climate variations is due to cyclic changes in the Earth’s orbit (Milankovitch cycles), the fluctuations in greenhouse gases play an important role in amplifying the initial temperature changes. In other words, the levels of greenhouse gases in the atmosphere were not only responding to the orbitally-induced temperature changes: they were also making the fluctuations in temperature larger than they would otherwise have been. This is good evidence for the suggestion that changing the concentration of greenhouse gases in the atmosphere (as we are doing today) will affect the Earth’s climate.
The range of glacial/interglacial carbon dioxide and methane concentrations shown in the Antarctic ice cores is between 180 and 300ppm (parts per million) and 320 and 790ppb (parts per billion) respectively. Hence the current levels of about 390ppm and 1820ppb are well beyond natural variation in recent geological time.
Recent climate change in Antarctica: the instrumental record
From the previous discussion on the relationship between levels of greenhouse gases and Antarctic temperature revealed in ice cores, one would expect Antarctica to show signs of warming in response to the rapid rise in greenhouse gases that has occurred over the past century. However, it needs to be remembered that the climate system is highly complex; and due to the influence of other climate factors, different regions respond differently to the climate ‘forcing’ of greenhouse gases. There are also time lags to be aware of: it takes time for changes in the composition of the atmosphere to begin to influence the weather; moreover, it requires many years of data before meaningful climate trends can be separated from random, year-to-year weather variations.
In Antarctica, there are relatively few places with long enough instrumental records (i.e. weather stations using standard techniques of weather recording for more than 30 years) to investigate recent climate change. However, it is possible to draw some conclusions from the data that are available. The climate of the Antarctic Peninsula has been well monitored compared with other parts of the continent, and data show that this is the fastest warming part of the Southern Hemisphere: the mean annual temperature has risen by about 3°C over the past 50 years. This is shown in the long instrumental record (extending back to 1945) from Vernadsky station (see Student Activities below). As described in The coast and adjacent seas, this is causing the disintegration of Peninsula ice shelves. For comparison, the surface air temperature averaged across the planet has risen by 0.74°C over the past century.
In contrast with the Peninsula, climate records from the interior of the continent do not yet show a clear warming trend. According to the Fourth Assessment of the Intergovernmental Panel on Climate Change (IPCC) (published in 2007), Antarctica is the only continent that does not show significant human-caused warming (averaged for the continent as a whole) over the past 50 years. However, using satellite data some scientists have argued more recently that West Antarctica is warming.
Browse monthly and mean annual temperature data sets from various Antarctic stations at the British Antarctic Survey website.
One explanation for the difference seen between the Peninsula and the interior is the influence of the ocean. As sea surface temperatures gradually warm due to the influence of increased greenhouse gases, maritime air masses also pick up this added warmth – and being surrounded by sea, the Peninsula is affected by this transfer of heat from the ocean far more than places inland. The near sea surface temperature of the Antarctic Circumpolar Current to the west of the Peninsula has increased by about 1°C over the past 50 years.
You can find out more about the IPCC and its projections of future climate warming at the following websites:
Antarctica’s climate future
Considering what the ice core records show, as greenhouse gases continue to accumulate in the atmosphere, it is likely that even the interior of the continent will eventually show signs of warming. Yet, it will be along the Peninsula and around Antarctica’s coastline where the strongest evidence of climate change will be seen.
Impacts of climate warming on glaciers, ice shelves, and sea ice are discussed in Ice, land and sea, and the impacts on ecosytems and wildlife are discussed in The terrestrial environment. Of global relevance, however, is how climate change in Antarctica will affect sea-level. As described in Ice sheets and glaciation, this requires estimates to be made about the mass balance of Antarctic glaciers – if negative, then more mass is being discharged into the ocean (through iceberg calving for instance) than is accumulating on the glacier through snowfall, causing a net rise in sea-level. In 2007 the Intergovernmental Panel on Climate Change concluded that over the period from 1993-2003 melt from Antarctica contributed about 0.2mm per year to sea-level rise.
Most glaciers on the Antarctic Peninsula now have a negative mass balance, and glacial melt from the northern Peninsula is currently contributing to sea-level rise of 0.16mm per year (similar to the contribution from melting glaciers in Alaska). Analyses of the West Antarctic Ice Sheet also show areas of negative mass balance, and there is concern for the long-term future of the WAIS because of its lower surface altitude and the fact that much of it is grounded below sea-level. A particularly vulnerable part of the WAIS is the Amundsen Sea Embayment section which would raise sea-level by 1.5 metres if it disappeared. If the whole WAIS were to melt, it would raise average sea-level by up to 6 metres, although it would take hundreds of years for this to happen. Interestingly, and worryingly, the disappearance of the huge mass of the WAIS would reduce the region’s gravitational pull on the sea, and therefore sea-levels would rise highest in areas more distant from West Antarctica, particularly along the North American coastline.
With its larger size, higher elevation, and higher grounding level, the East Antarctic Ice Sheet is less vulnerable to climate change, and it is possible that higher temperatures might even lead to a more positive mass balance and a thickening of the EAIS because of increased snowfall in the interior. The total contribution that Antarctica will make to global sea-level rise over the next century is still unclear and the subject of much research.
You can learn more about climatic change in the Antarctic and its consequences in these sections of the BAS website:
If you have Google Earth, you can follow this link to open up a file on Antarctic climate impacts (pictures and facts) that you can view in Google Earth:
Student activity 1
Using the text above and any of the suggested web links, write a briefing paper to describe the evidence contained in Antarctic ice cores and to explain their significance for understanding the Earth’s climate system.
Student activity 2
Study the diagram above that compares long-term temperature changes and carbon dioxide levels revealed in the EPICA ice core and answer the following questions:
-
How many glacial/interglacial cycles appear to have occurred over the time spanned by this ice core record?
-
Give an estimate of the frequency of glacial/interglacial cycles.
-
Which climate transitions appear to have happened most rapidly – warmings or coolings?
-
How many times (and at roughly what times) were temperatures at least as high as they are today?
-
If there was no human effect on climate, how would you expect the climate to change over the next several thousand years?
-
Describe the relationship over time between temperature and atmospheric carbon dioxide.
-
Approximately how much higher is the atmospheric concentration of carbon dioxide today in comparison with the maximum levels seen in the ice core record?
-
Close analysis of the ice cores shows that the increases in carbon dioxide occur slightly after the shifts to warmer temperatures begin. Some have used this fact to suggest that carbon dioxide levels themselves have little effect on climate. Why might that argument be flawed?
Student activity 3
3a The attached Excel spreadsheet contains mean annual temperature data from Vernadsky station (Faraday/Vernadsky) (located 65°15’S,64°16’W on Galindez Island, Antarctic Peninsula) along with mean annual carbon dioxide concentrations extending back to 1959. Copy the data attached here into your own spreadsheet and do the following:
-
Make a graph plotting the mean annual temperature against the years of record.
-
Add a trendline to the graph.
-
Create a caption for the graph that describes the trend and gives an estimate of the rate of temperature increase based on the trend line.
-
Make a second graph plotting mean annual temperatures against carbon dioxide concentrations for equivalent years. (Mean annual temperature on the Y-axis, carbon dioxide on the X-axis.)
-
Add a trendline to the graph and create a caption that describes the nature of the relationship between the two variables and the strength of the relationship shown.
3b Give your opinion about how strongly this graph supports the view that humans are causing climate change through greenhouse gas emissions. In what ways should one be careful in interpreting a correlation graph based on a single site? What additional evidence would help in coming to a conclusion about the effects of global warming on Antarctica?
3c On correlation plots, by convention the independent variable is plotted on the X-axis and the dependent variable on the Y-axis (assuming that the X-axis variable affects the Y-axis variable but not vice versa). Why is this a safe assumption for your correlation graph using local temperature data? What problems might there be with this assumption if a similar plot were drawn using mean annual air temperature averaged across the Earth? (Hint: think about aspects of the global carbon cycle.)
