
Using your data
Once you’ve collected data, it’s time to examine it.
Activity 1
-
Using the data you’ve collected from the land, sea and air, create charts and/or graphs to visualise what the data is telling you. Can you see any trends or links between the different datasets? What observations can you come up with from your newly acquired data?
-
In groups, see if you can come up with some ideas as to why these trends or observations might be happening.
Here are a few ideas to get you started:
-
How can sea water temperature be less than 0°C without the water freezing?
-
Air temperature seems to get colder with height, then warmer, then colder again. Why?
-
Are the three geological areas studied all the same? If not, why do you think they are different rock types and ages?
Activity 2
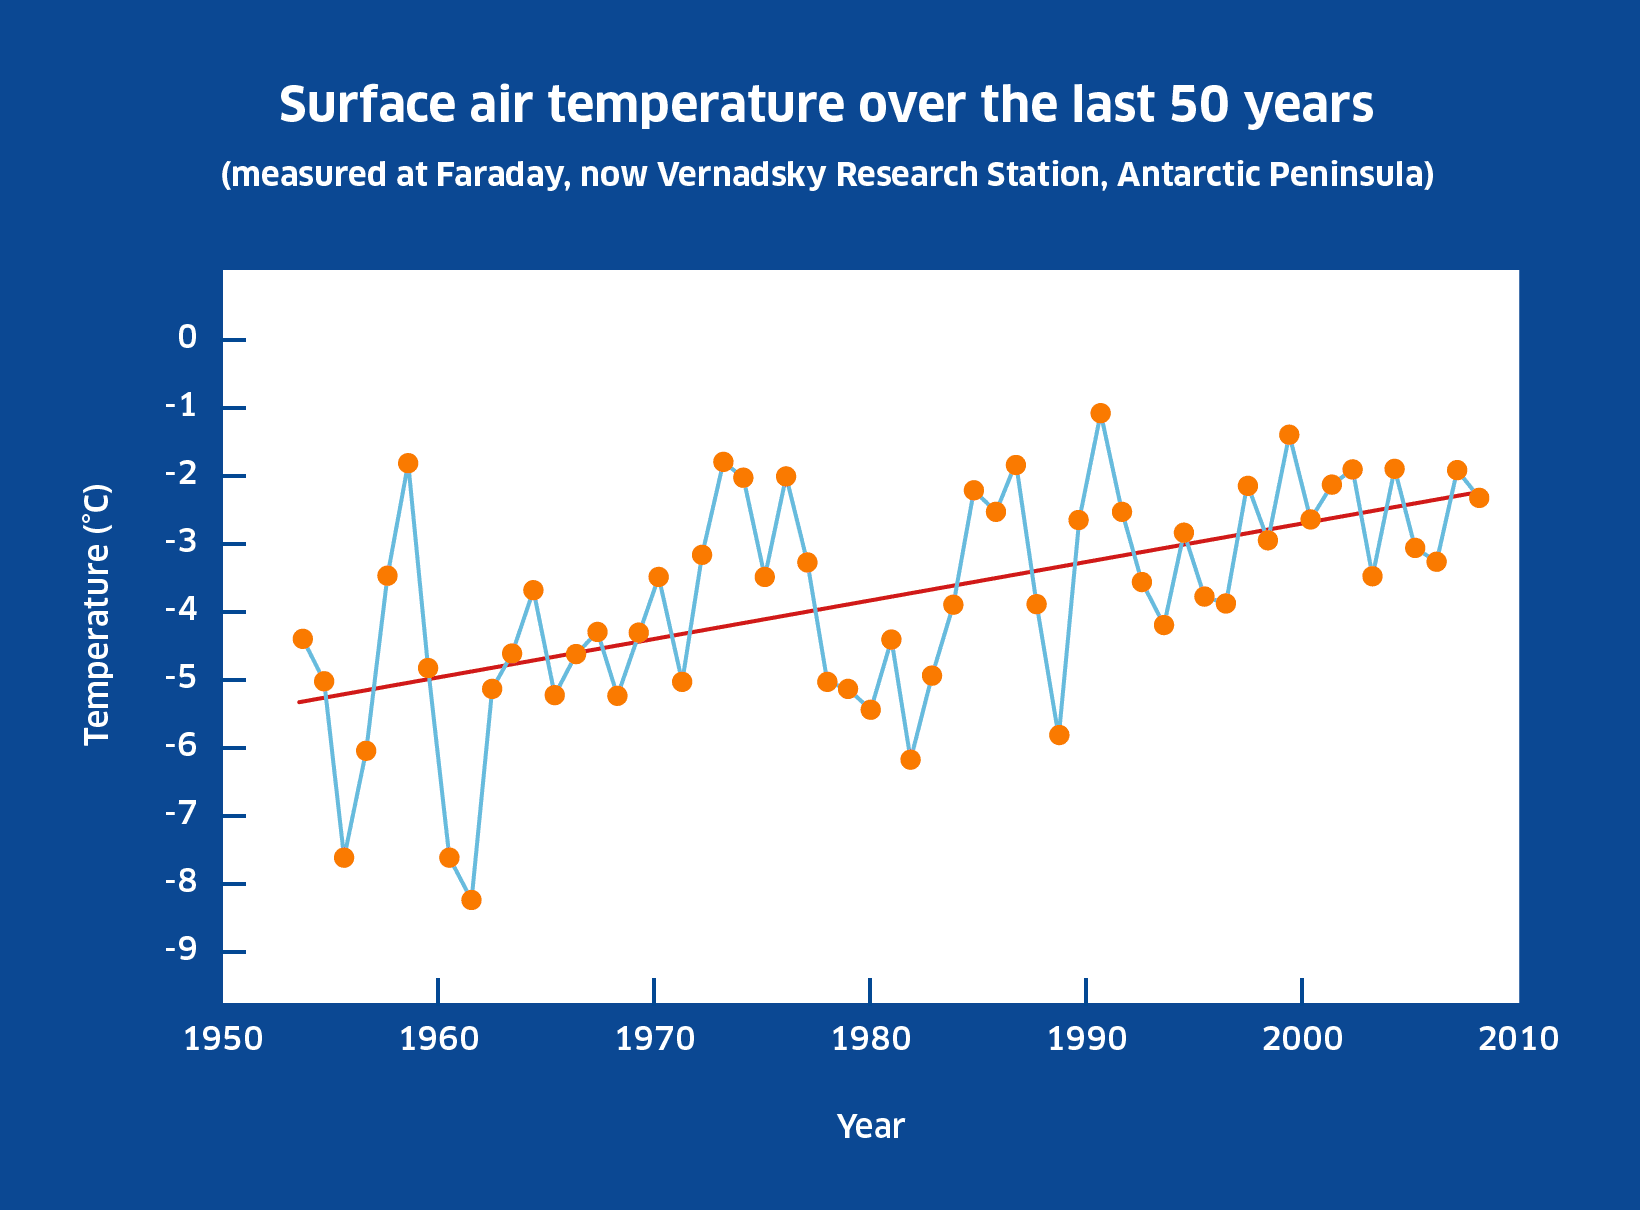
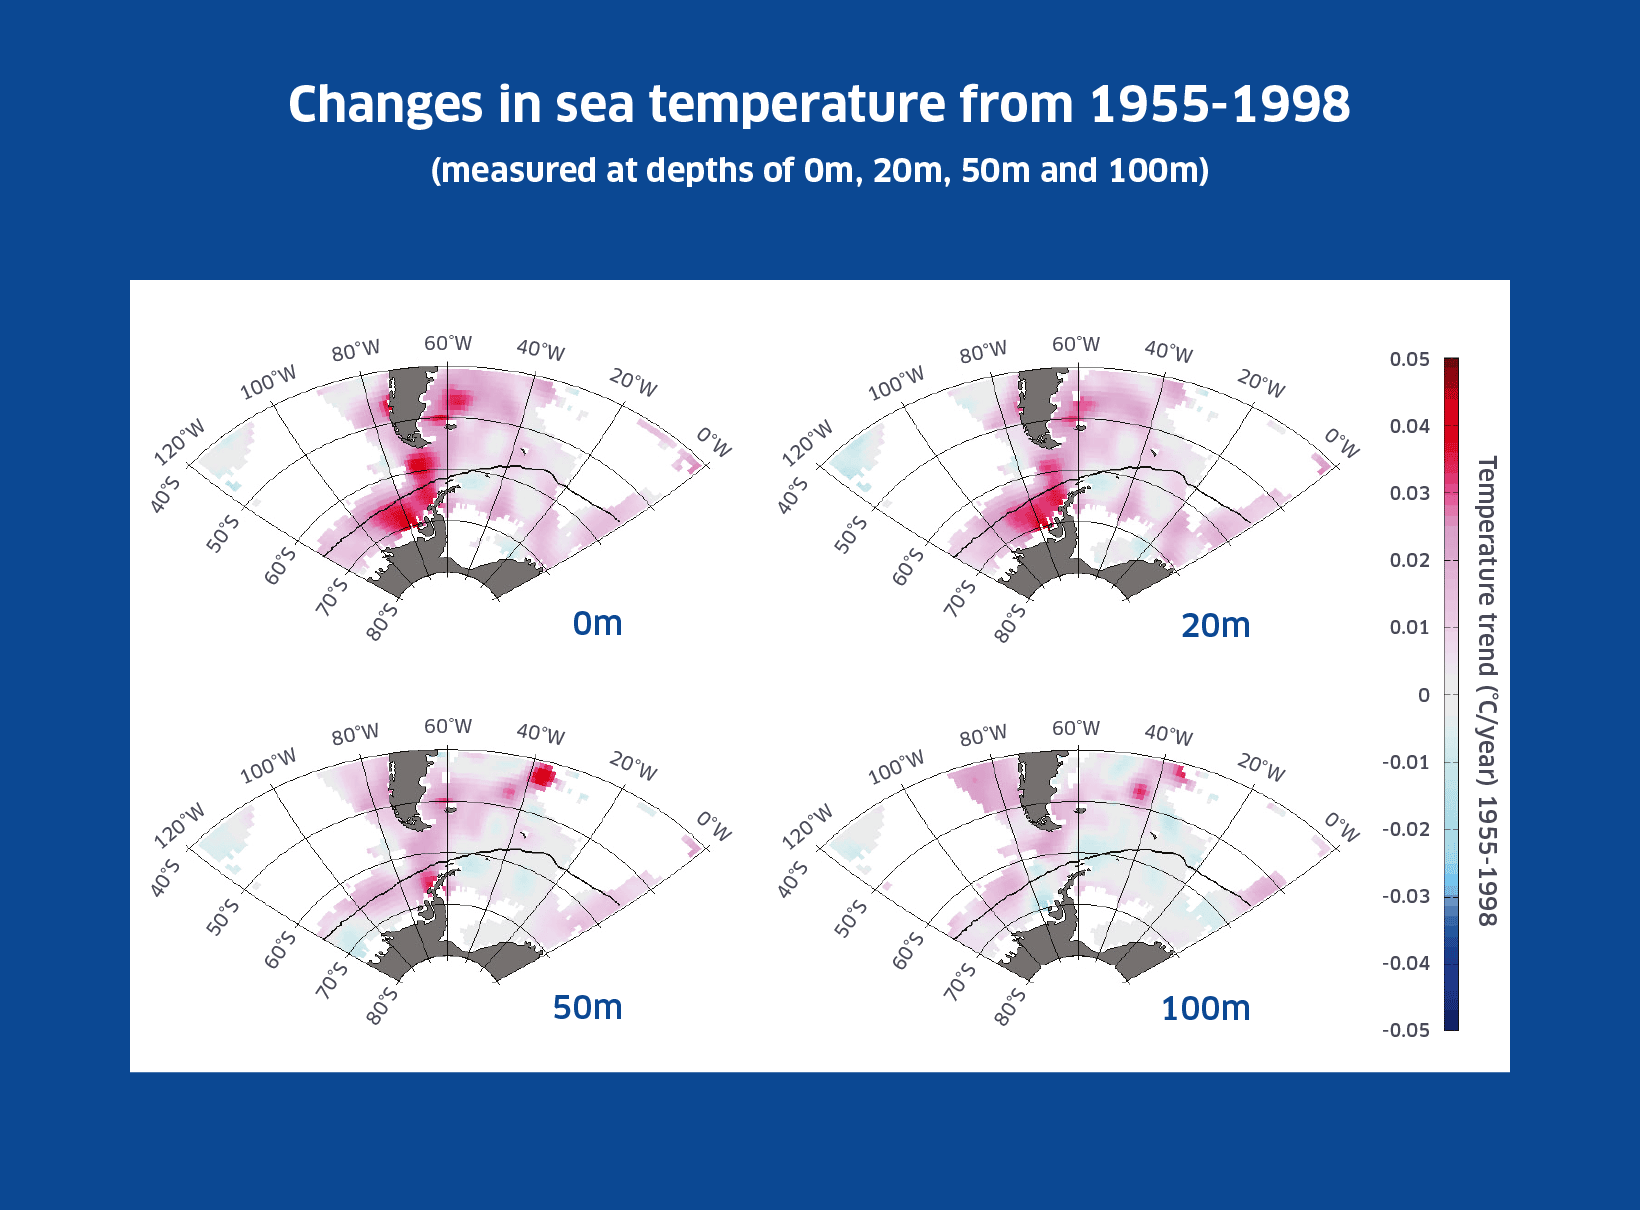
Look at the graph and diagram below showing changes in air and sea-surface temperature for the Antarctic Peninsula over the last 50 years.
-
What conclusions can you draw from the results? What might be causing the changes? How does the sea-temperature change differ at various depths?
Activity 3
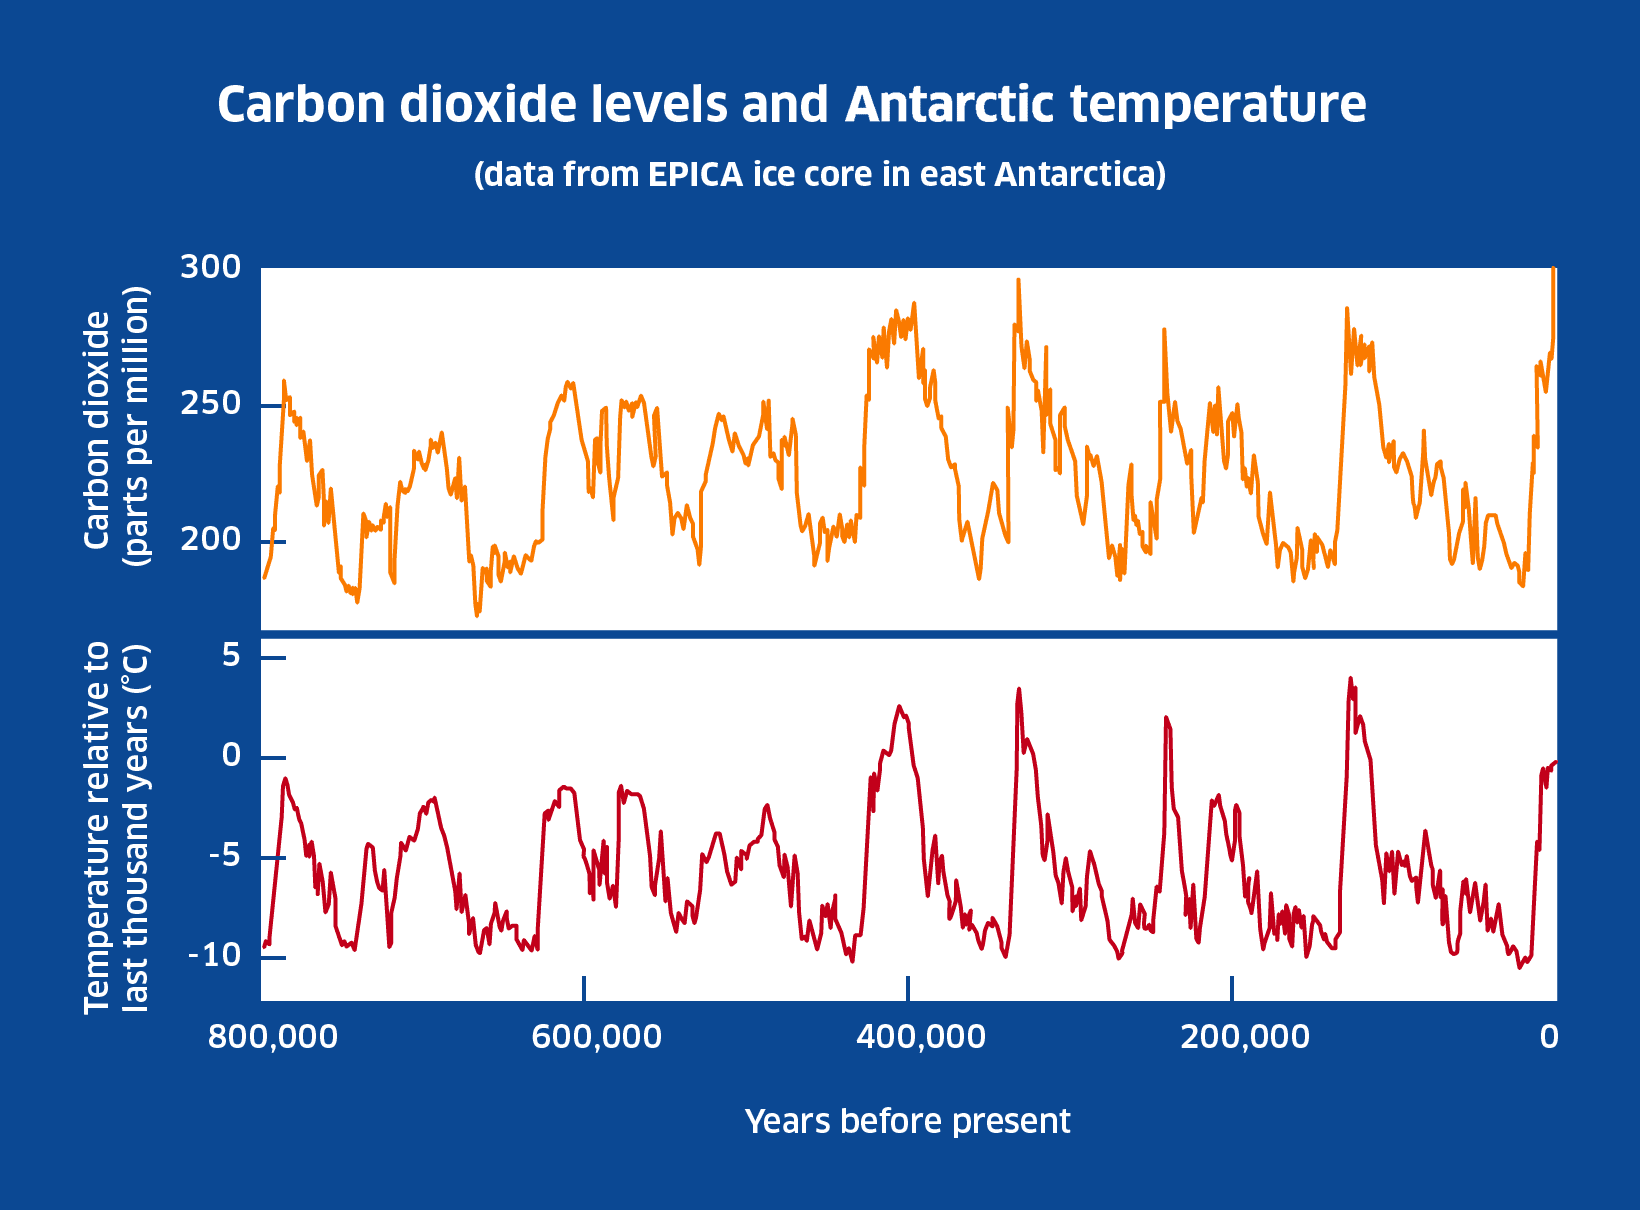
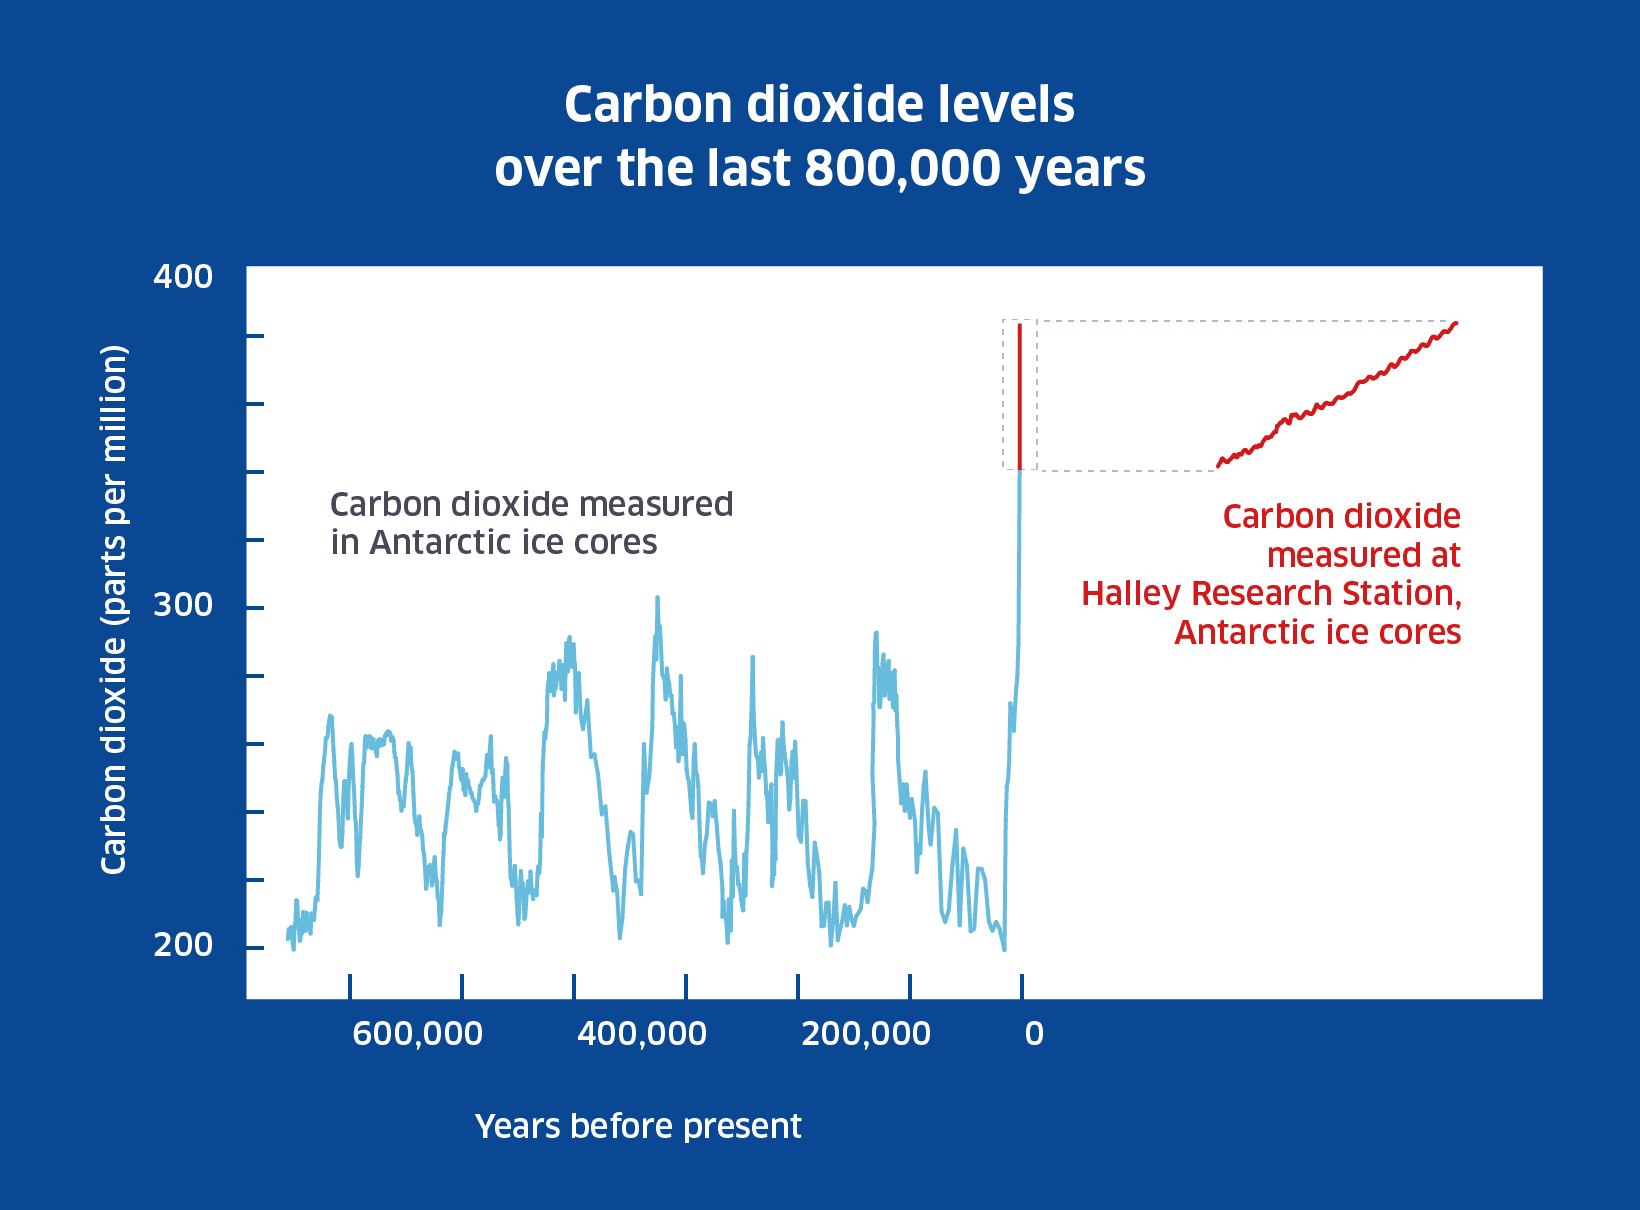
Look at the graphs showing carbon dioxide (CO2) concentration in the Earth’s atmosphere and global temperature over the last 800,000 years. This ice-core data covers the last seven ice-ages and highlights how greenhouse gases have been closely linked to global air temperature in the Earth’s past.
On the second graph, look carefully at the last 25 years and compare current CO2 levels with those in the distant past.
-
Discuss what effects you think this may have on the global temperature in the future?
Activity 4
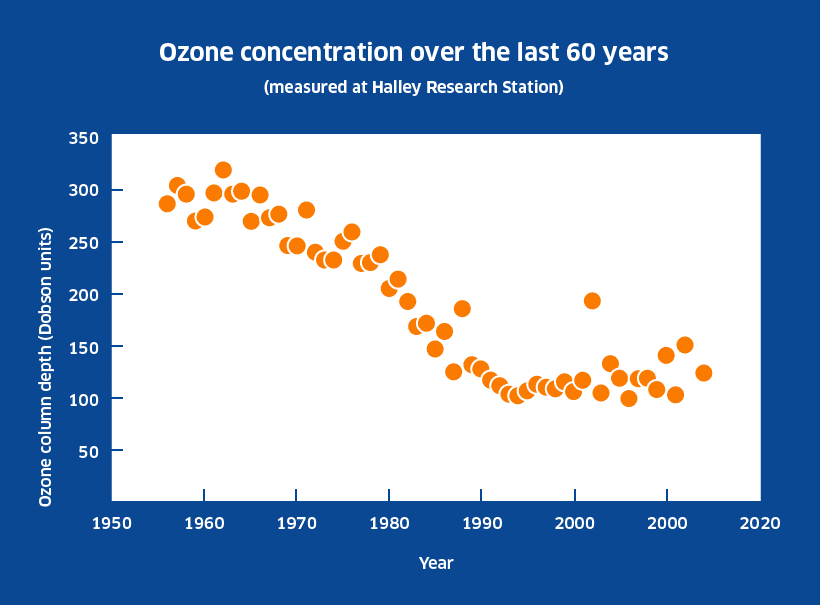
Look at the graph showing ozone concentration over Halley Research Station between 1956 and 2008.
-
Does the ozone data prove that mankind can affect the global atmosphere?
-
Does it also show that international co-operation can change things for the better following the 1987 Montreal Protocol to ban the use of CFCs that caused the Ozone Hole?